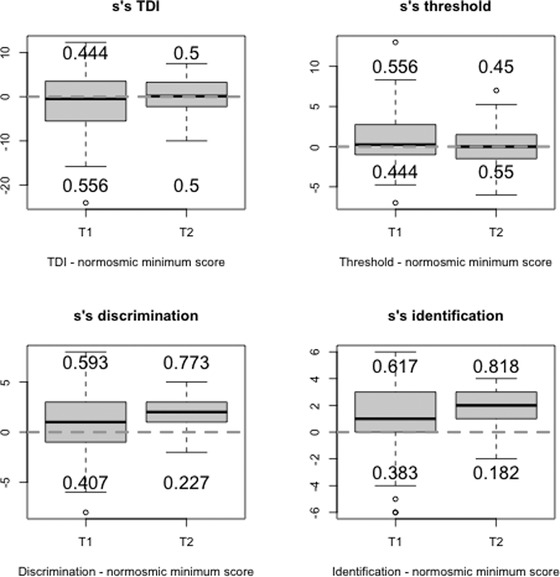
FIGURE 1.

Box‐plots showing the distributions of the differences between patients’ scores (TDI) and the normosmic minimum score (10th percentile of the distribution of the scores for normosmic) 10 at T1 and T2. The numbers indicate the proportion (decimals) of subjects with normal scores (above the dotted line) and with pathological scores (below the dotted line). Dotted line: Normosmic minimum score. Abbreviations: S'S: Sniffin’ Sticks; T1: first psychophysical olfactory test; T2: second psychophysical olfactory test. TDI, threshold, discrimination, and identification.
