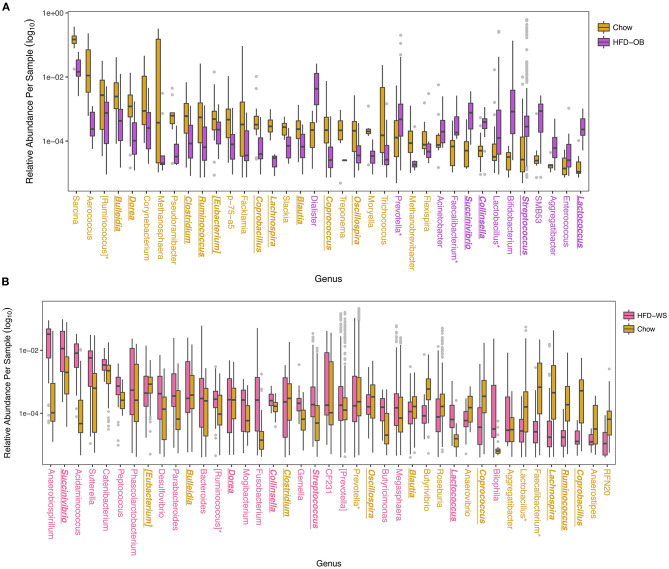
Figure 3.
Differentially abundant taxa between high-fat and chow diets show overall consistency with a few disparate results. Significantly different OTUs are named by their genus level and were determined by DESeq2 using age and treatment, and time when applicable, as covariates. Colors for (A) High-fat Oleic Blend study and (B) Recovery from High-fat Diet study are ordered chronologically to represent which diet was received first. The HFD-OB contained three different levels of cholesterol and were combined for analysis because there were no significant differences between them. Colored taxa names refer to which treatment the abundance was higher. Taxa that have consistent trends between the two studies are bolded, italicized, and underlined, and taxa that have opposite trends are designated with an asterisk.

