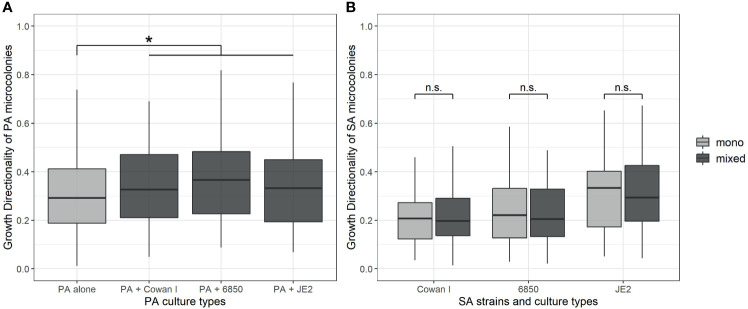
Figure 3.
Directionality of microcolony growth of P. aeruginosa (PA) and S. aureus (SA) in monoculture (light-grey) and mixed culture (dark-grey). We calculated the directionality of growth as De/Da (where De is the euclidean and Da is the accumulated distance, respectively). The closer this ratio is to 1.0, the more directional the movement of a microcolony is. (A) Growth directionality of PA microcolonies is significantly increased in the presence of SA. (B) Growth directionality of SA microcolonies is not affected by the presence of PA for none of the SA strains. The box plots show the median (bold line) with the first and the third quartiles. The whiskers cover the 1.5* inter-quartile range (IQR) or extend from the lowest to the highest value if they fall within the 1.5* IQR. *p < 0.05, n.s., not significant. Data is from three independent experiments per PA-SA combination, with a total of 352 and 323 microcolonies for PA and SA strains, respectively.

