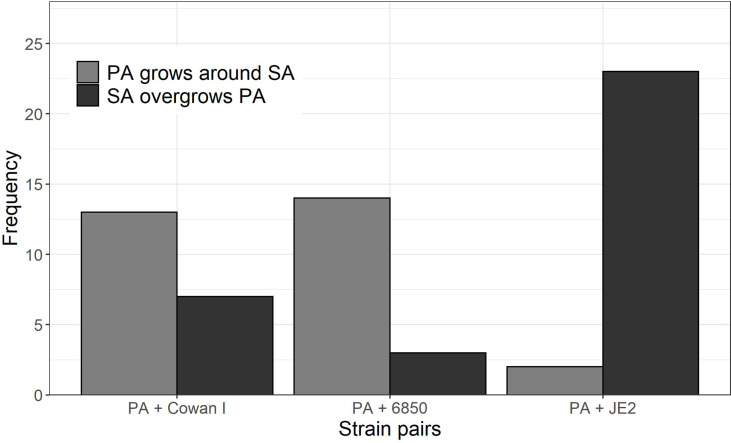
Figure 4.
Behavioral patterns when P. aeruginosa (PA) and S. aureus (SA) microcolonies come into close contact with each other. We scanned all time-lapse image series and manually counted the frequency of the following two events: (1) PA grows around SA microcolonies (n = 29), and (2) SA pushes PA aside and (sometimes) overgrows PA microcolonies (n = 33). The frequency of these two types of events significantly differ across the three strain pairs (Fisher’s exact test p < 0.0001). Visual examples for the two behavioral patterns can be found in the Supplementary Movies 2-4 (event 1: Movie S2 and S3; event 2: Movie S4). As a comparison, Movie S1 shows PA growing in monoculture. Data is from three independent experiments per PA-SA strain pair.

