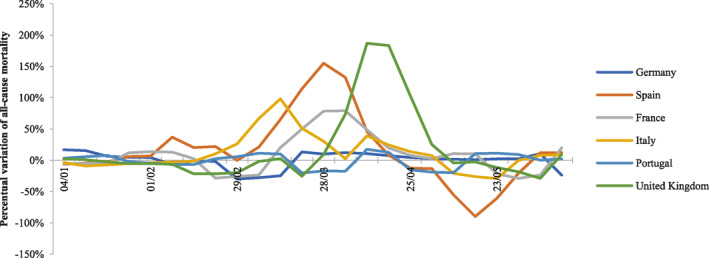
FIGURE 3.

Maximum variation (%) of all‐cause mortality (10 years period or latest available) between 1st January and 30th June 2020

Maximum variation (%) of all‐cause mortality (10 years period or latest available) between 1st January and 30th June 2020