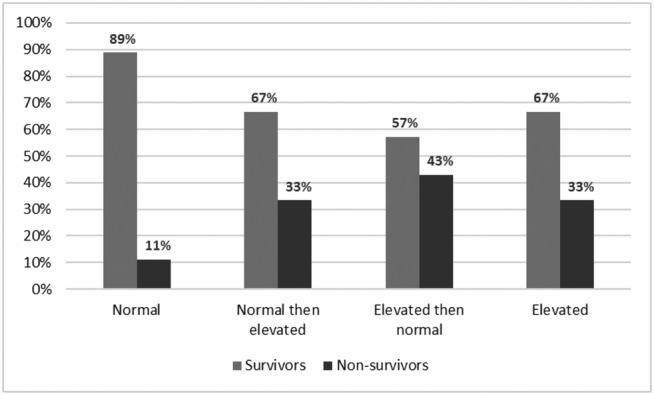
Figure 1.

Intra‐hospital mortality stratifying patients according to the trend of troponin level during the first two days of hospitalization [normal troponin (N = 81) vs. normal troponin then elevated (N = 15) vs. elevated troponin then normal (N = 14) vs. elevated troponin (N = 87), overall P value: 0.001].
