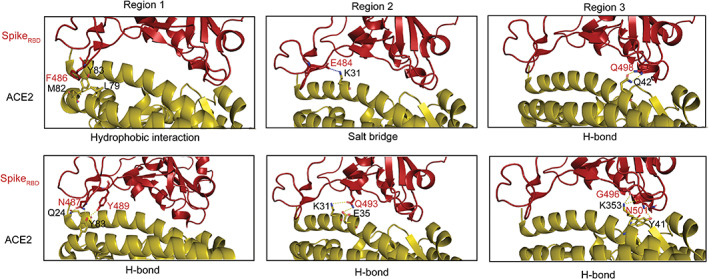
FIGURE 2.

Identification of RBD–ACE2 complex interface residues. Residues from RBD are labeled in red and those from ACE2 in black. The interface residues distribute in three regions. Region 1 encompasses hydrophobic interactions between residue pairs F486‐M82 and Y83‐L79, and H‐bonds between N487‐Q24 and Y489‐Y83. Region 2 shows a salt bridge between E484 and K31, as well as two H‐bonds formed between Q493 and residues K31/E35. Region 3 shows three H‐bonds between Q498‐Q42, G496‐K353, and N501‐Y41, respectively
