Figure 1.

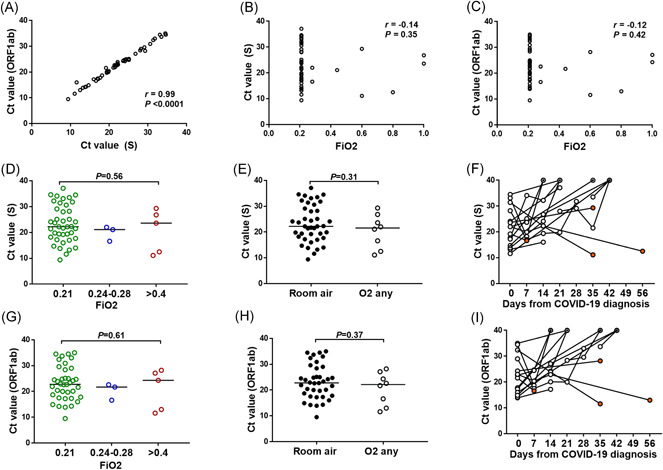
Lack of correlation between SARS‐CoV‐2 PCR cycle threshold (C t) values and oxygen requirements at the time of PCR testing. (A–C) Spearman correlation between S and ORF1ab gene targets on the same clinical specimen (A), and between each SARS‐CoV‐2 gene target and the recorded fraction of inspired oxygen (FiO2) (B–C) at the time of sample collection for PCR testing. (D–I) Distribution of SARS‐CoV‐2 C t values across requirements of FiO2 strata at the time of PCR testing for S (D–E) and ORF1ab (G–H) genes. Bars corresponds to the median C t value. p value was calculated using Mann–Whitney or Kruskal–Wallis tests where appropriate for comparison between groups. Trajectory of C t values over time for patients with 2 or more PCR swabs available (F, I). All negative values were given a value of 40 indicated with circled dot. Three patients with negative PCR documented on routine testing obtained more than 6 weeks from previous positive test were considered outliers and not included in the figure. Orange circles correspond to the last C t value available if patient is deceased. PCR, polymerase chain reaction; SARS‐CoV‐2, severe acute respiratory syndrome coronavirus 2
