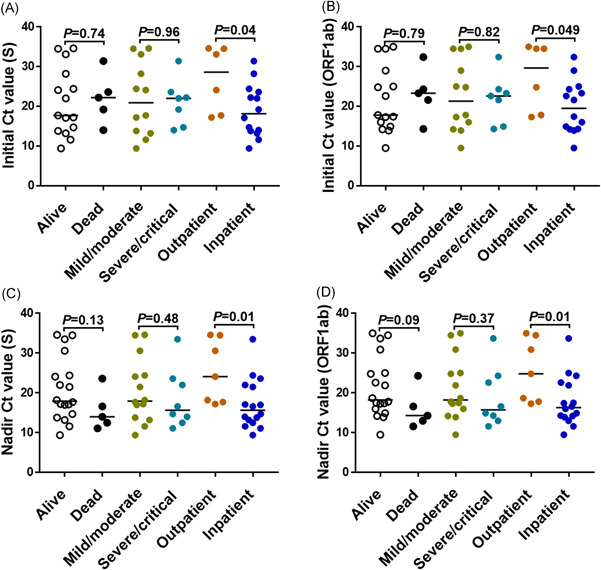
Figure 2.

Lower SARS‐CoV‐2 PCR C t value among COVID‐19 patients requiring hospital admission. Initial (A–B) and nadir (C–D) SARS‐CoV‐2 C t values by clinical outcome are shown for the gene targets specified in the y‐ axis. COVID‐19 severity was defined as follows: mild (the clinical symptoms are mild and no pneumonia manifestations can be found in imaging); moderate (pneumonia manifestations on imaging); severe (tachypnea with respiratory rate >30 per minute, hypoxia requiring FiO2 > 0.4 to attain SpO2 > 94%, a ratio of arterial partial pressure of oxygen to fraction of inspired oxygen [PaO2/FiO2]<300 mmHg, and/or lung infiltrates >50%); and critical (respiratory failure requiring mechanical ventilation, septic shock and/or multiorgan failure). Data for maximum COVID‐19 severity missing in one patient admitted at an outside hospital. p value was calculated using Mann–Whitney for comparison between groups. COVID‐19, coronavirus disease 2019; C t, cycle threshold; PCR, polymerase chain reaction; SARS‐CoV‐2, severe acute respiratory syndrome coronavirus 2.
