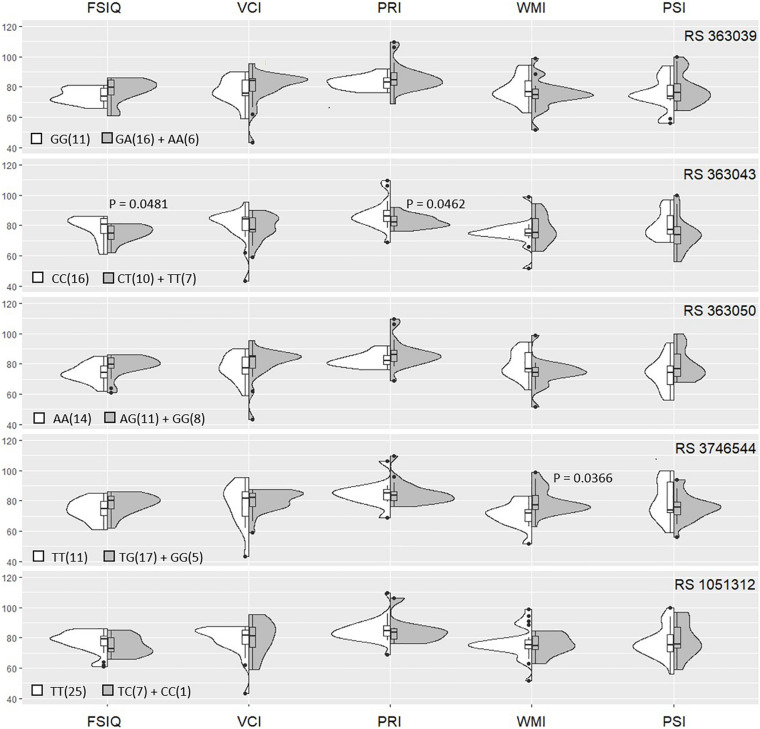
FIGURE 1.
Violin plots of Kernel’s smoothed distributions of WISC-III/IV scores by SNAP-25 genotypes. The box plots present the distribution of each IQ score (median and interquartile range) relatively to the genotype distribution. The “violin” area indicate the percentage of children with BIF for each allele (in gray the minor allele and white the major allele).

