Figure 1.

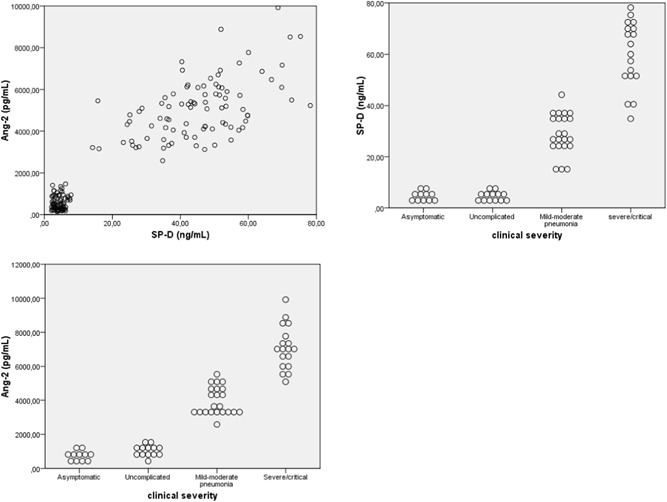
The dot plots graphic the correlation between SP‐D and Ang‐2 and between SP‐D/Ang‐2 with the clinical severity of disease, Ang‐2, angiopoetin‐2; SP‐D, surfactant protein D

The dot plots graphic the correlation between SP‐D and Ang‐2 and between SP‐D/Ang‐2 with the clinical severity of disease, Ang‐2, angiopoetin‐2; SP‐D, surfactant protein D