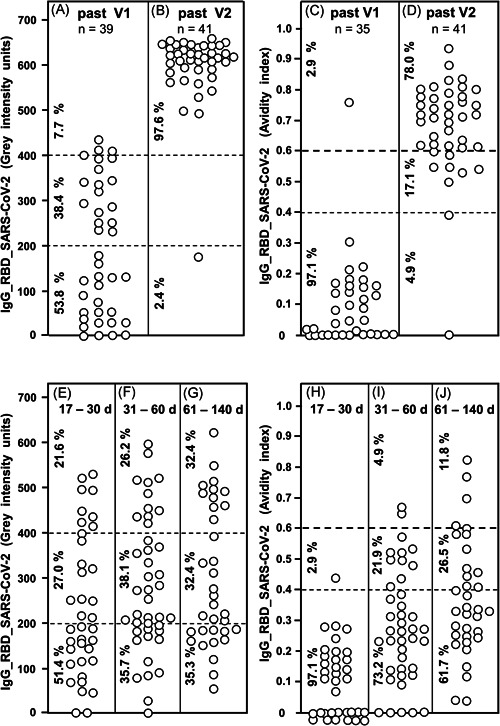
Figure 6.

IgG responses after vaccination and natural infection with SARS‐CoV‐2. Thirty‐nine sera taken between 9 and 22 days after first vaccination with the BioNTech/Pfizer vaccine (A) and 41 sera taken between 6 and 25 days after second vaccination with the BioNTech/Pfizer vaccine (B) were tested for IgG directed toward SARS‐CoV‐2 RBD. The determined gray intensity units are shown under A and B, whereas the avidity indices, determined by parallel treatment with 7 M urea after incubation of serum with test antigens, are shown under C (sera obtained after the first vaccination) and D (sera obtained after the second vaccination). For comparison, 37 sera were taken from COVID‐19 outpatients between 17 and 30 days after the onset of the disease (E), 42 sera from COVID‐19 outpatients taken between 31 and 60 days after the onset of the disease (F) and 34 sera from COVID‐19 outpatients taken between 61 and 140 days after the onset of the disease were tested for IgG directed toward RBD (gray intensity units). The avidity indices of these sera were determined and are shown (H−J). The figure shows a variable induction of IgG after the first vaccination (A), which extends to uniformly high values after the second vaccination (B) (p < 0.001). This is paralleled by low avidity indices after the first vaccination (with one exception) and high avidity in 78.0% of the samples taken after the second vaccination (p < 0.001). Though natural infection with SARS‐CoV‐2 can also induce IgG concentrations of higher levels, a broad range of intensities is maintained over long times without statistically significant changes (E−G). Though a certain degree of avidity maturation in the low and intermediate range was seen with time for sera from patients with natural SARS‐CoV‐2 infection, only a minority of sera (11.8%) reached high avidity values (>0.6) (H−J) at 61−140 days after natural infection, whereas 78% of sera taken from vaccinated individuals had reached avidity indices above 0.6 between 6 and 25 days after the second vaccination (p < 0.001). The median values calculated from the data presented in Figure 6 are summarized in Figure S20. The confirmation of the data presented in Figure 6A−D through the increase in the number of vaccinated subjects are presented in Figure S18. COVID‐19, coronavirus disease 2019; IgG, immunoglobulin G; RBD, receptor‐binding domain; SARS‐CoV‐2, severe acute respiratory syndrome coronavirus 2
