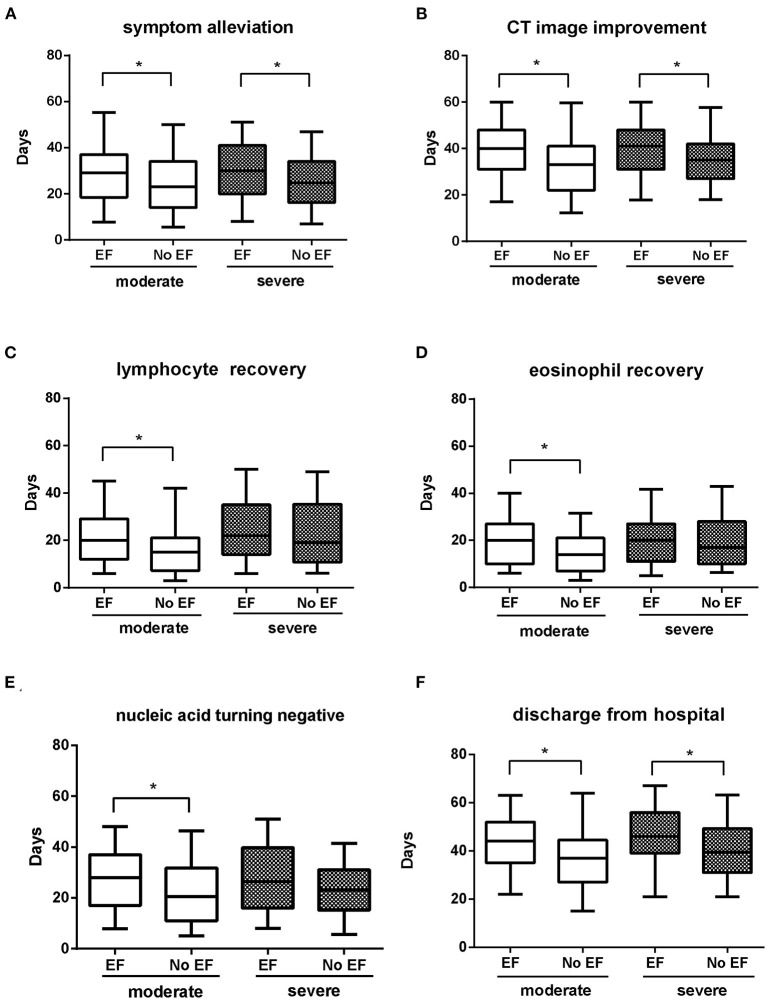
Figure 3.
Comparison of clinical outcomes in EF and non-EF COVID-19 patients with moderate/severe infection. Time from symptom onset to symptom alleviation (A); CT image improvement (B); lymphocyte recovery (C); eosinophil recovery (D); nucleic acid tests turning negative (E); time of discharge from hospital (F). Whiskers of the boxplot mark the 5th and 95th percentiles, while the box contains 25th percentile, median, and 75th percentiles. COVID-19, coronavirus disease; EF, early fever, defined as the incidence of fever (Tmax ≥ 37.3°C, measured using an ear thermometer) within 5 days of symptom onset. *P < 0.05 for EF patients vs. non-EF patients in corresponding severity conditions.

