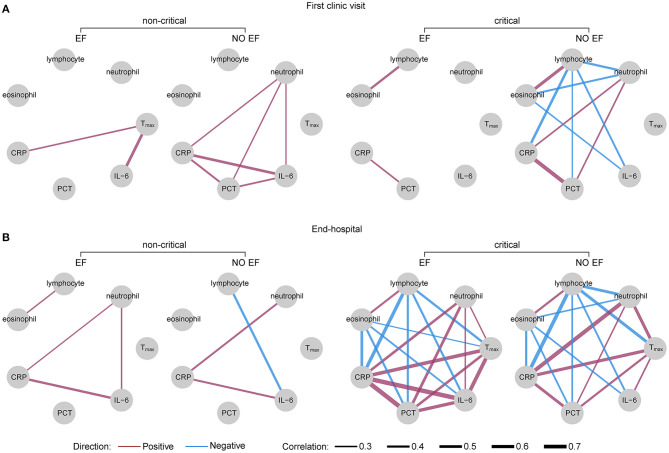
Figure 6.
Correlation networks of Tmax, immunologic cells, and biomarkers in EF and non-EF COVID-19 patients. Networks showed different profiles of correlations between EF and non-EF patients in critical and non-critical conditions at the first clinic visit (A) and end-hospitalization (B). The width of the edge showing stronger or weaker interactions is proportional to the absolute value of correlation (|r|). Edges were observed only when |r| > 0.2. A purple edge indicates a positive correlation, and a blue edge indicates a negative correlation. COVID-19, coronavirus disease; EF, early fever, defined as the incidence of fever (Tmax ≥ 37.3°C, measured using an ear thermometer) within 5 days of symptom onset. Tmax, maximum body temperature from symptom onset to the first clinic visit (A), and Tmax in the last 3 days before end-hospitalization (B). PCT, procalcitonin; CRP, high-sensitivity C-reactive protein; IL-6, interleukin-6.

