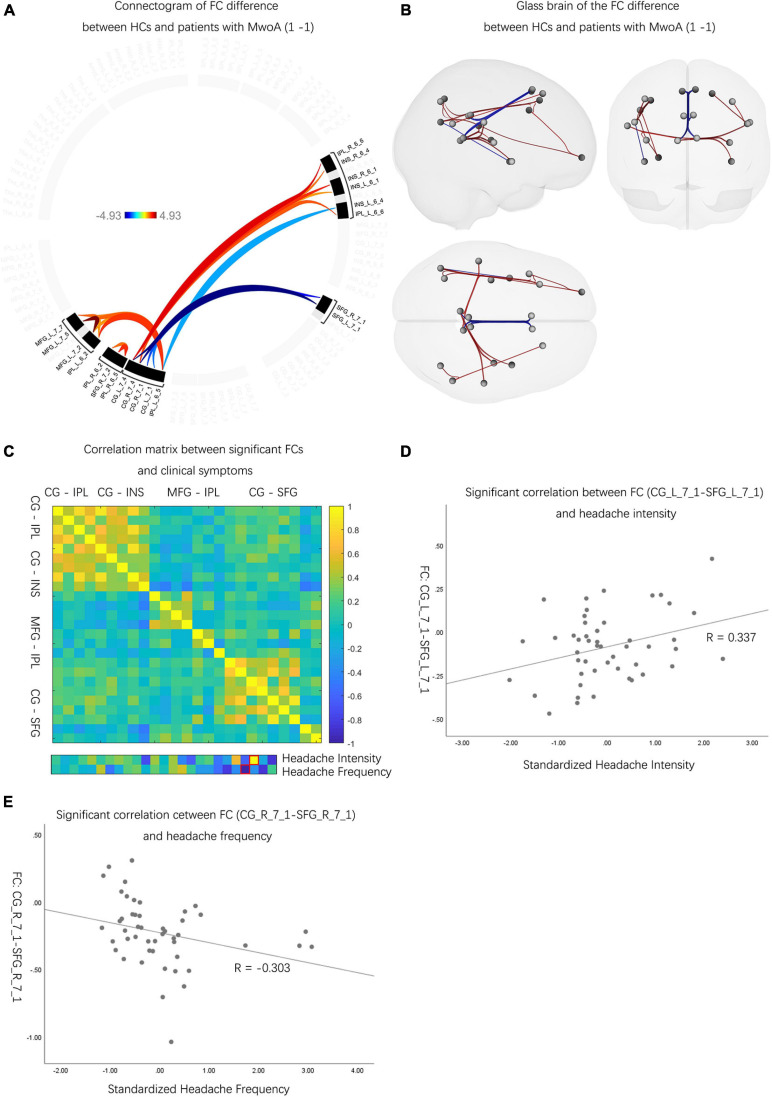
FIGURE 2.
The neuro activities difference between patients with MwoA and HCs. (A) Patients with MwoA manifested significantly decreased and increased FCs compared with those in HCs, and the color bar represents the t-value of FC. (B) Patients with MwoA manifested significantly decreased FCs between CG and IPL, CG and INS, MFG and IPL, and within IPL subregions, MFG subregions. Moreover, patients with MwoA had significantly increased FCs between CG and SFG. Red connection lines represent an increased FC of HCs than patients with MwoA, and blue lines vice versa. (C) Two FCs were significantly correlated with headache intensity and frequency, with the red rectangle circling the significantly correlated FCs. The color bar represents the Pearson correlation coefficient, and the closer the absolute value is to 1, the higher the correlation is, and vice versa. (D) The FC between the left CG and the left SFG was significantly correlated with headache intensity (r = 0.337, p < 0.05). (E) The FC between the right CG and the right SFG correlated with headache frequency (r = –0.303, p < 0.05). MwoA, migraine without aura; HC, healthy control; FC, functional connectivity; L, left hemisphere; R, right hemisphere; SFG, superior frontal gyrus; MFG, middle frontal gyrus; SPL, superior parietal lobule; IPL, inferior parietal lobule; INS, insular gyrus; CG, cingulate gyrus; Amyg, amygdala; Hipp, hippocampus; Tha, thalamus.

