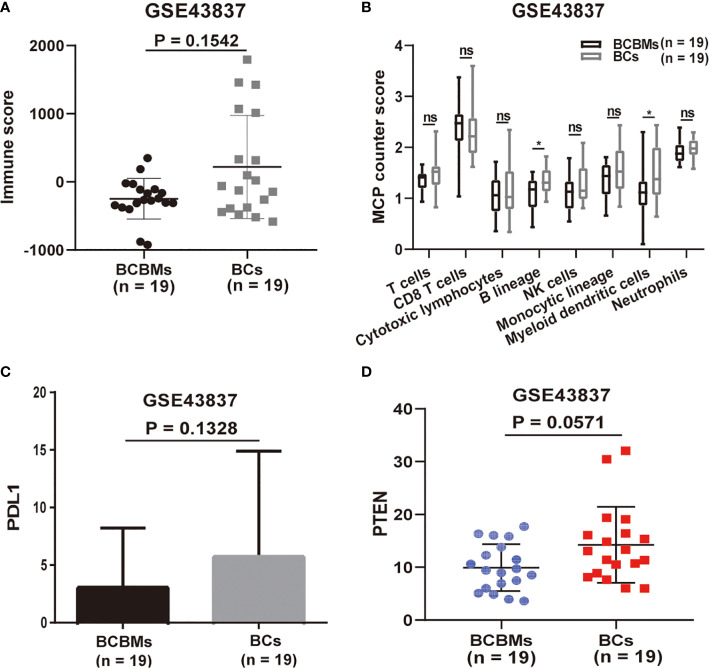
Figure 2.
Immune infiltration heterogeneity in BCBMs compared with BCs (GSE43837). (A) ESTIMATE immune analysis of BCBMs (n=19) and BCs (n=19) (GSE43837). Lines represent mean ± SD, and each dot represents a single sample. Significance was determined via Wilcoxon rank-sum test. (B) MCP-counter analysis of indicated immune cell populations in BCBMs (n = 19) and BCs (n = 19) from GSE43837. Each plot is a simple box and whisker plot. Median values (lines) and interquartile range (whisker) are indicated. ns, not significant (P > 0.05); *P < 0.05. Significance was determined via a Wilcoxon rank-sum test. (C) Comparison of CPM for PDL1 RNA expression between BCBMs (n = 19) and BCs (n = 19) from GSE43837. Lines represent mean ± SD. Significance was determined via Wilcoxon rank-sum test. (D) Comparison of CPM for PTEN RNA expression between BCBMs (n = 19) and BCs (n = 19) from GSE43837. Lines represent mean ± SD, and each dot represents a single sample. Significance was determined via Wilcoxon rank-sum test.

