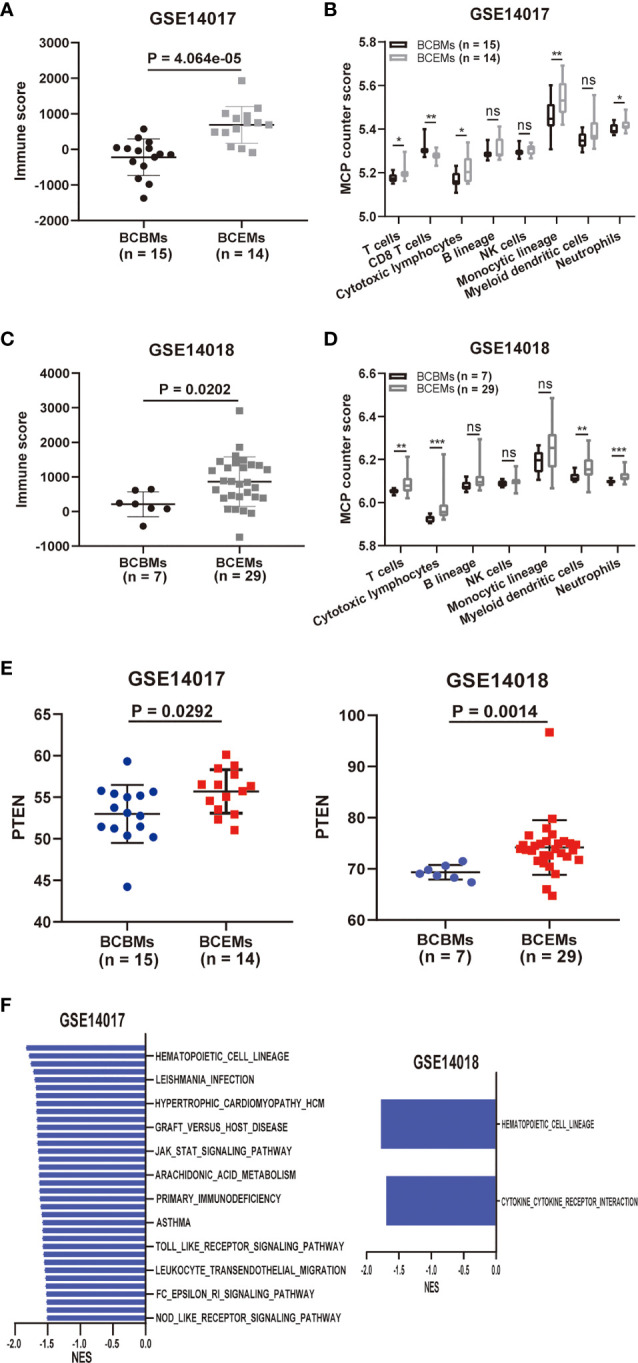
Figure 5.

Comparison of immune and metabolic characteristics between BCBMs and BCEMs. (A, B) ESTIMATE immune and MCP-counter analysis of BCBMs (n = 15) and BCEMs (n = 14) (GSE14017). (C, D) ESTIMATE immune and MCP-counter analysis of BCBMs (n = 7) and BCEMs (n = 29) (GSE14018). (E) Comparison of CPM for PTEN RNA expression between BCBMs (n = 15) and BCEMs (n = 14) from GSE14017, BCBRs (n = 7) and BCEMs (n = 29) from GSE14018. Significance was determined via Wilcoxon rank-sum test. (F) GSEA analysis demonstrating all KEGG metabolism significantly altered (p < 0.05, FDR < 0.25) in BCBMs versus BCEMs (GSE14017 and GSE14018). The normalized enrichment score (NES) forms the x-axis. Downregulated gene sets are shown in red. No upregulated gene sets met the criteria for statistical significance. ns, not significant; *P < 0.05, **P < 0.01, ***P < 0.001, determined by Wilcoxon rank-sum test.
