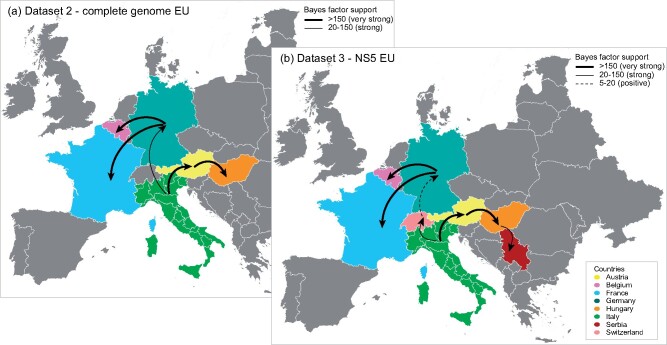
Figure 4.
Spatial spread of USUVs detected in Europe. Maps showing statistically supported non-zero rates (BF > 5) of the EU lineages resulted from the analyses of two distinct datasets: (a) Dataset 2—complete genome, (b) Dataset 3—NS5. The location trait provides for a division of Europe on a country level. The thickness of the dashed lines representing the rates is proportional to the relative strength by which rates are supported: very strong (BF > 150, thick lines), strong (20 < BF < 150, medium lines) and positive (5 < BF < 20, dashed lines).

