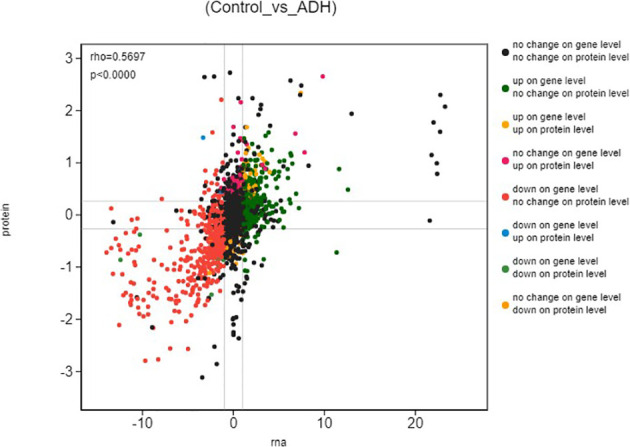
Figure 5.

Differential expression analysis (Control_vs_ADH) The ordinate represents the expression of multiple proteins in a pair of comparison groups, the log2 (ratio of protein), the abscissa represents the expression of multiple corresponding transcript in the comparison group, the log2 (ratio of gene), logarithm difference takes the logarithmic value respectively; each point represents a protein and its associated transcript, the upper left corner of the picture rho represents the Pearson correlation coefficient between the two groups, p represents the correlation test p value; rho < 0 indicates negative correlation; rho > 0 indicates positive correlation; rho=0 indicates no correlation; the greater the rho, the greater the correlation between the two groups.
