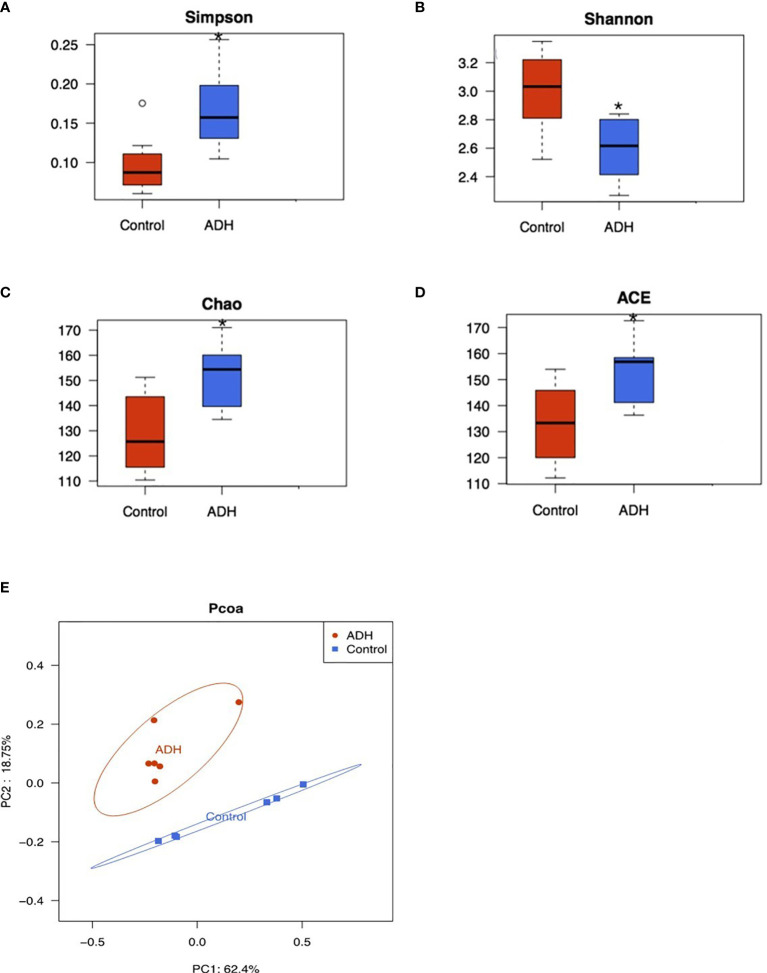
Figure 7.
Diversity and composition analysis of intestinal flora. (A) Simpson index comparison box chart; (B) Box-plot of diversity Shannon index comparison; (C) A box chart of Chao index comparison of diversity; DBox-plot of ACE index comparison of diversity; Compared with the Control group,0.05. PCOA analysis of samples; (D). Red represents ADH group and blue represents Control group; (E) PCOA analysis of the samples, Red represents ADH group and blue represents Control group. *P < 0.05.

