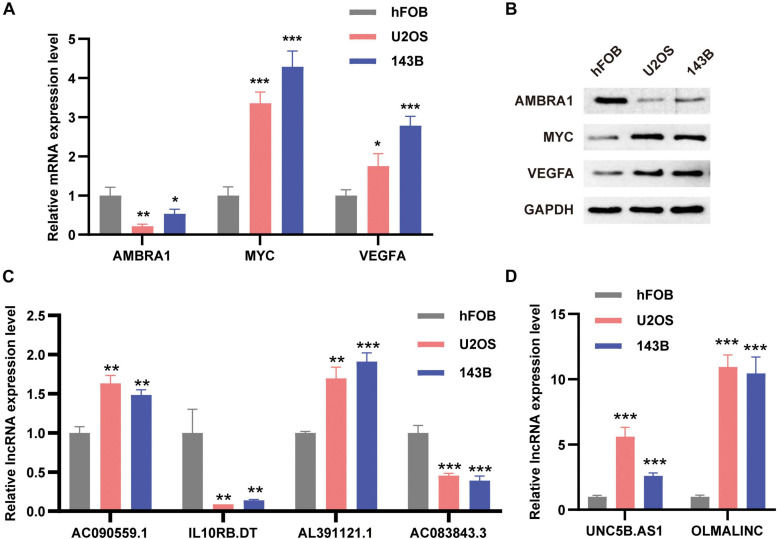
FIGURE 10.
The expression levels of ARGs and ARLs in osteosarcoma cell lines were compared with those of osteoblasts. (A) The qRT-PCR result of the three ARGs was evaluated by the 2–ΔΔCT method. (B) Western blotting results of AMBRA1, MYC, and VEGFA expression. (C,D) The qRT-PCR result of the six ARLs was evaluated by the 2-ΔΔCT method. The data are expressed as mean ± standard deviation. *P < 0.05, **P < 0.01, and ***P < 0.001.

