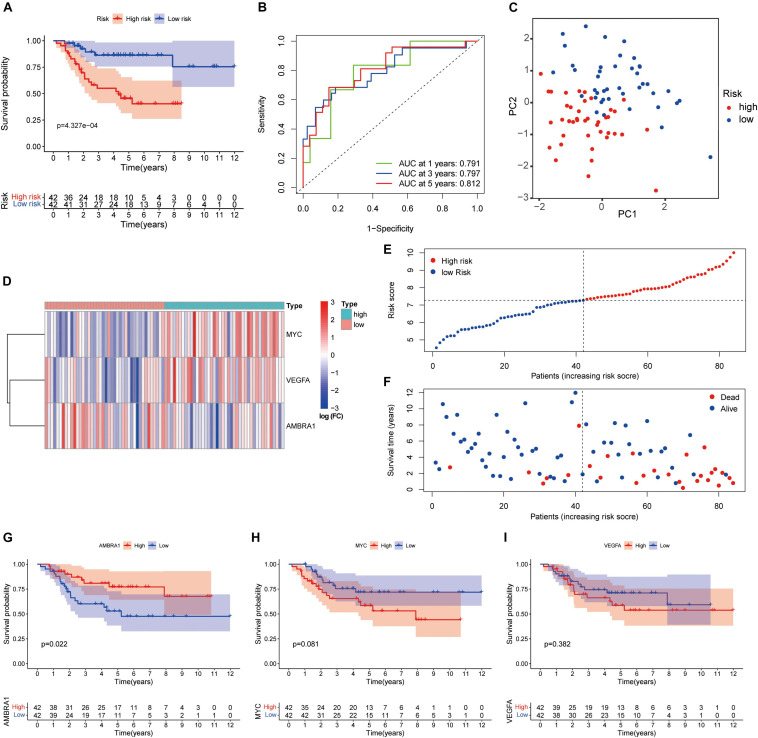
FIGURE 6.
Autophagy-related genes (ARGs) signature based on TARGET. (A) Kaplan–Meier curves result. (B) The AUC for the prediction of 1, 3, 5-year survival rate of osteosarcoma. (C) PCA based on the confirmed three ARGs signature. (D) Heatmap of the key genes expressed between the high and low risk group. (E,F) Risk score analysis of the signature. (G–I) Kaplan–Meier curves results of single gene.

