
Figure 1.
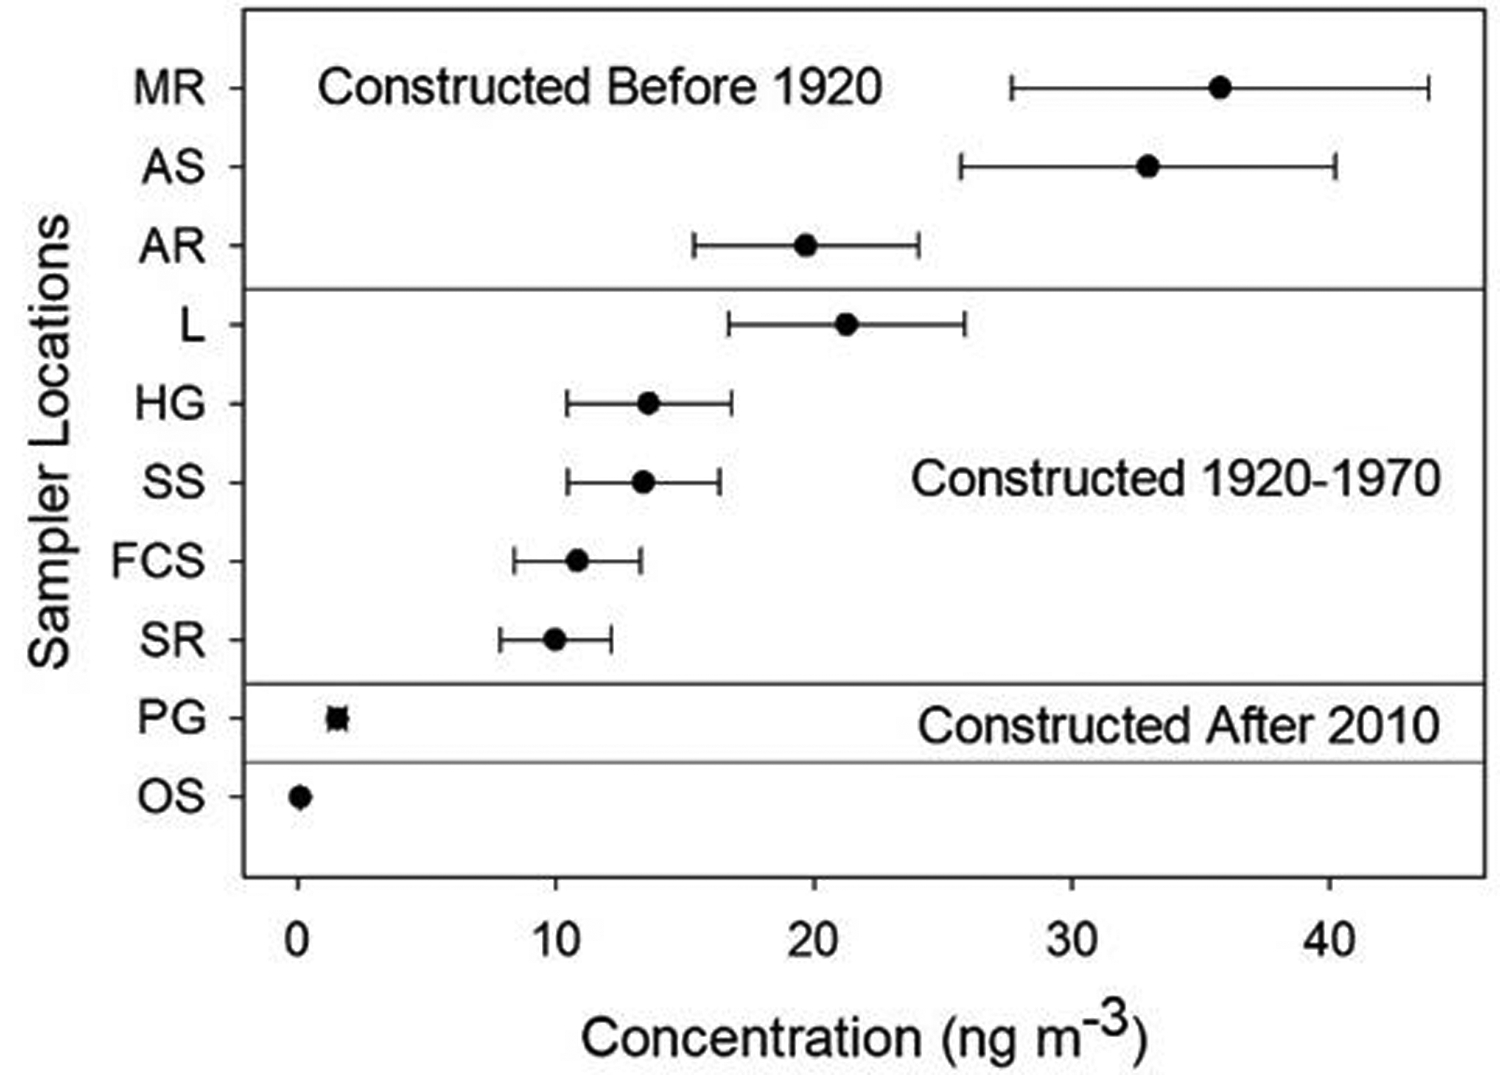
PCB concentration distributions in each location. The dot is the most probable concentration value from the distribution and the error bars represent one standard deviation from that value. Samplers were placed in the math room (MR), art storage (AS), art room (AR), library (L), social studies (SS), family consumer science (FCS), high school gym (HG), science room (SR), practice gym (PG), and outside (OS).