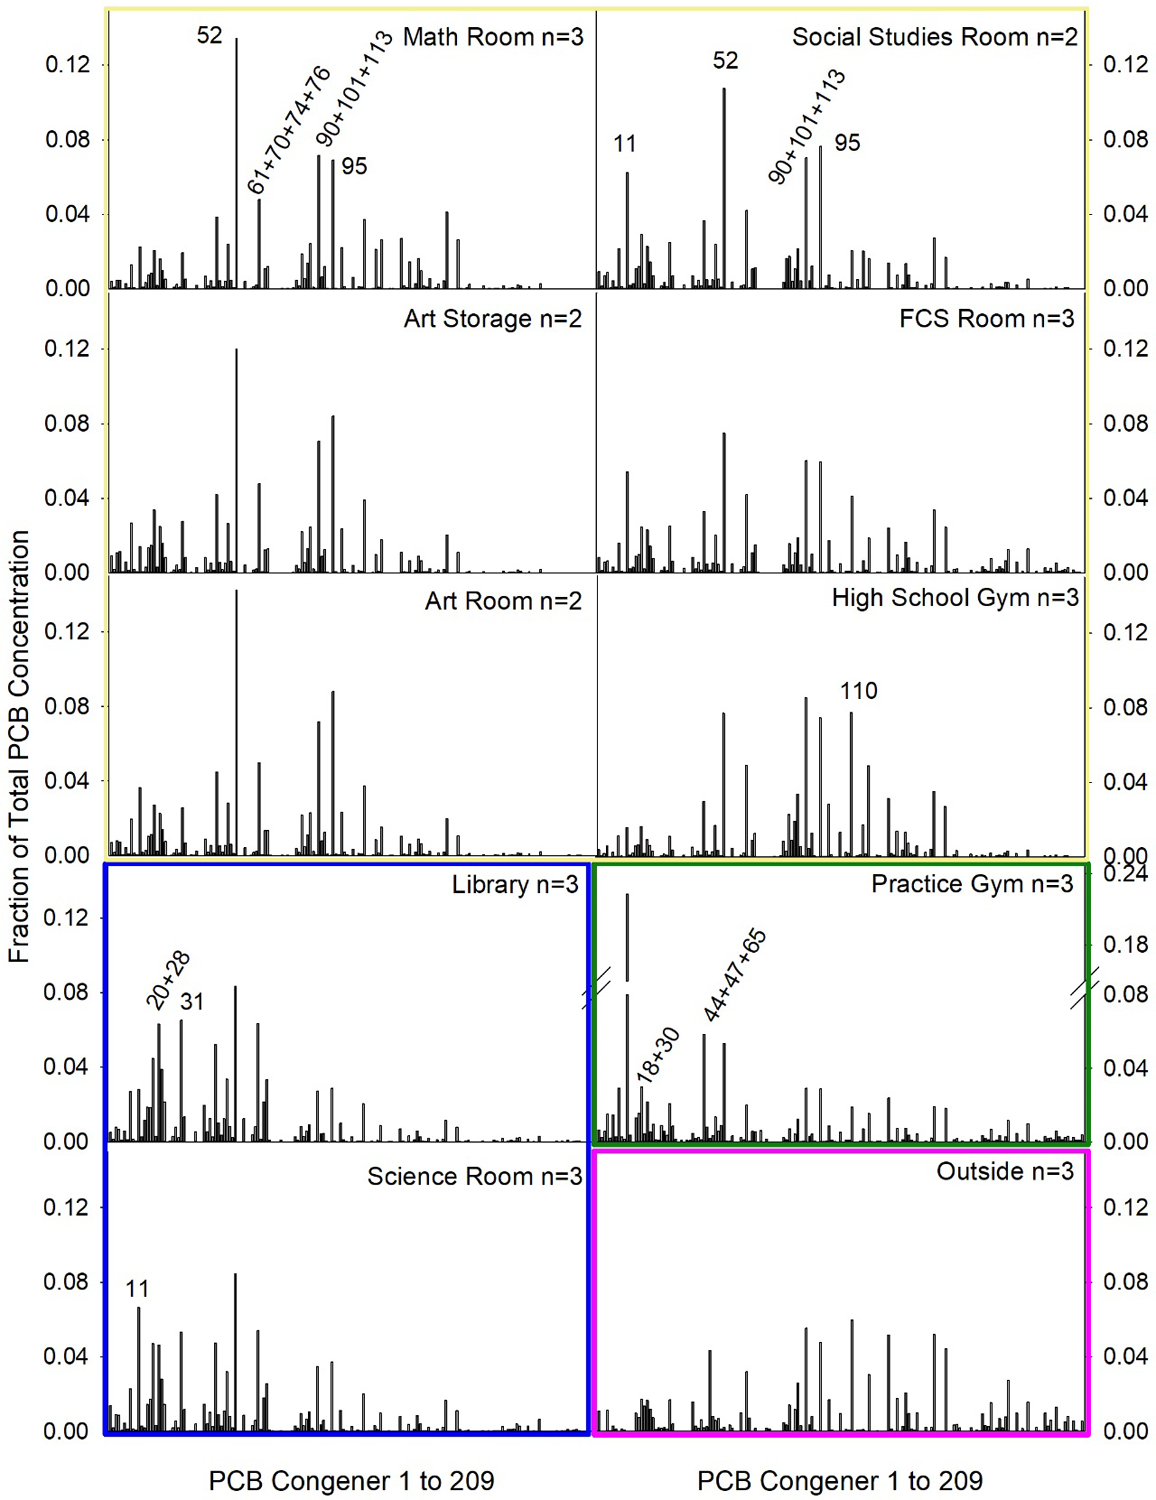
Figure 2.

Average fraction of total PCB concentration in each location. Error bars are omitted for clarity. Rooms outlined in the same color share similar profiles (cos θ > 0.9): the math, social studies, art, art storage, and family consumer science rooms, and high school gym in yellow; and the library and science room in blue. The practice gym (green) and the outside air (pink) exhibited unique profiles.
