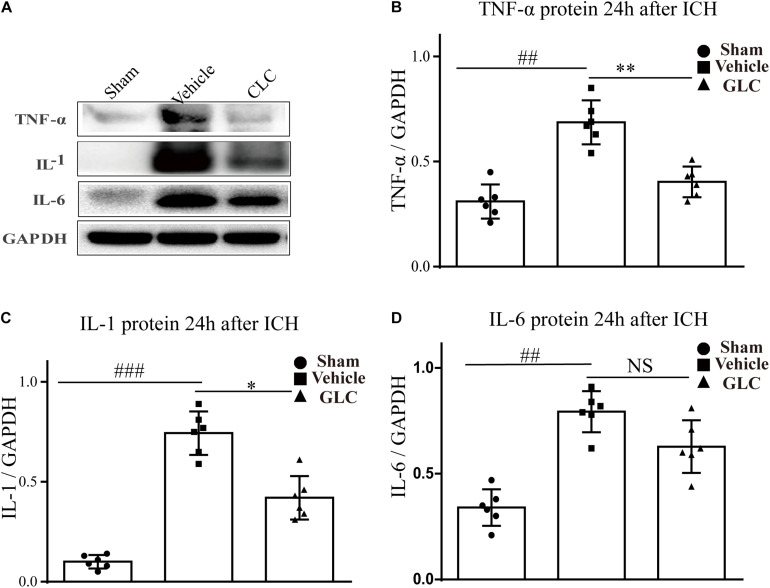
FIGURE 6.
Effect of glibenclamide (GLC) on neuroinflammation protein expression following intracerebral hemorrhage (ICH). The band intensity quantification is presented as the mean ± SD, (A,B) tumor necrosis factor (TNF)-α: vehicle vs. sham ##p < 0.01, vs. GLC ∗∗p < 0.01; (A,C) IL-1: vehicle vs. sham ###p < 0.001, vs. GLC ∗p < 0.05; (A,D) IL-6: vehicle vs. sham ##p < 0.01, vs. GLC p > 0.05.

