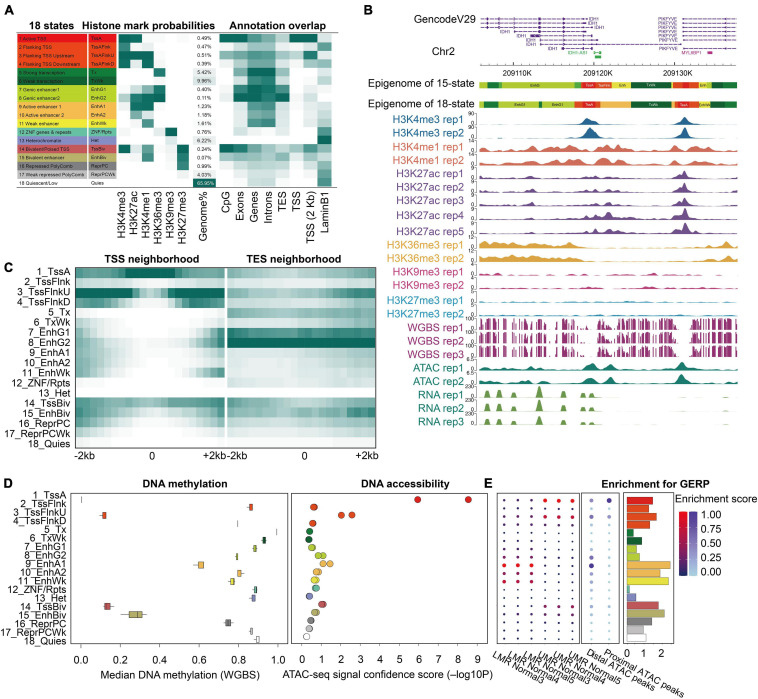
FIGURE 1.
Epigenomic 18-state map of the prostate epigenome based on six histone modification marks. (A) Epigenomic 18 states definitions, histone mark probabilities, average genome coverage, and genomic annotation enrichments. The 18-state joint model from the Roadmap was used to generate 18 states of the prostate whole genome with the same colors and mnemonics. Different annotations of hg19 were used for the enrichment analysis. (B) An example region of all datasets in this study, which shows the prostate 18/15-state epigenome, six histone marks, WGBS, ATAC-seq, and RNA-seq data using the WashU Epigenome Browser. Normalized intensity of the ChIP-seq, ATAC-seq, and RNA-seq signals is shown. The values on the y-axis for WGBS indicate the methylation level of each CpG site. (C) Enrichment of the18-state epigenome in the 4-kb neighboring regions of the transcription start site (TSS) and end site (TES). (D) Median DNA methylation level and ATAC-seq signal confidence -log10 (p-value) were calculated per state. (E) Enrichment of lowly methylated regions, unmethylated regions (left), distal ATAC peaks, proximal ATAC peaks (middle), and GERP evolutionarily conserved non-exonic nucleotides (right).

