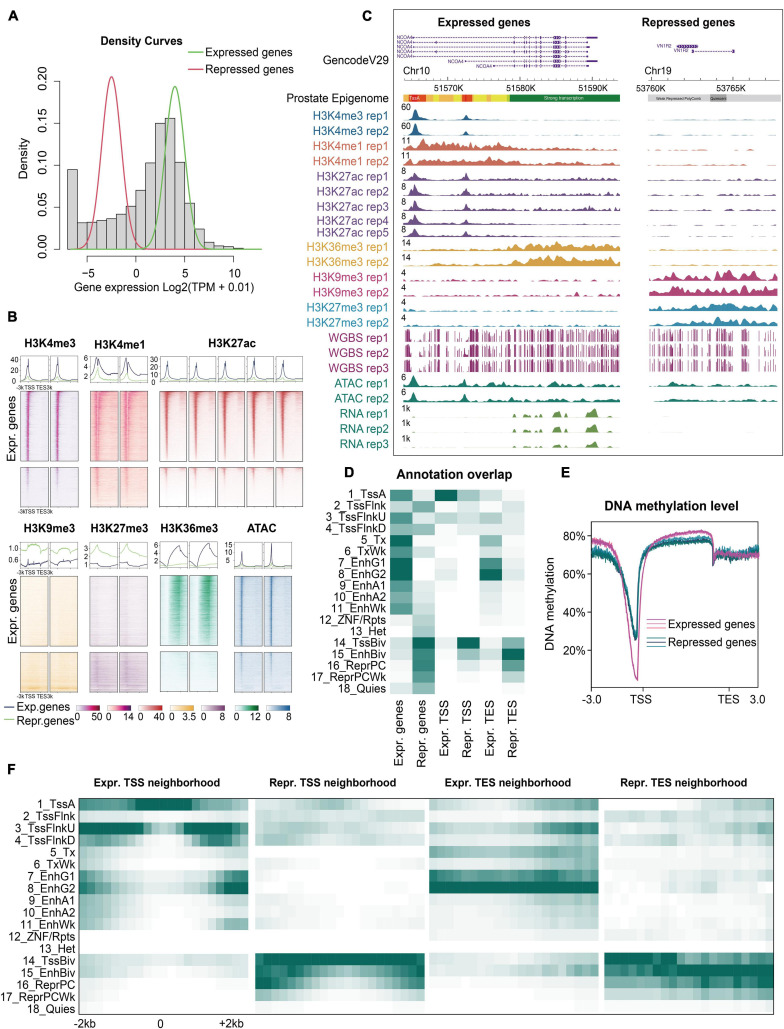
FIGURE 2.
Epigenomic characteristics of expressed and repressed genes. (A) Density histogram. All genes were divided into two clusters: Expressed (green line) and repressed genes (red line) using a Gaussian mixture model based on the mean log2 (TPM + 0.01) value of each gene in the prostate. (B) The normalized signals of all ChIP-seq and ATAC-seq datasets were calculated for the expressed and repressed genes, respectively. All rows of heatmaps (top: Expressed genes, bottom: Repressed genes) are in the same descending order according to the gene expression levels. (C) Snapshot of an example showing the dramatically distinct epigenomic landscapes of the expressed and repressed genes using WashU Epigenome Browser. Normalized intensity of the ChIP-seq, ATAC-seq, and RNA-seq signals is shown. The values on the y-axis for WGBS show the methylation level of each CpG site. (D) Enrichment of the expressed and repressed genes, at their transcription start site (TSS) and end site (TES). (E) Expressed and repressed genes showing different DNA methylation signatures in three replicates. (F) The neighborhood of TSS and TES enrichments for the expressed and repressed genes, respectively (± 2 kb).

