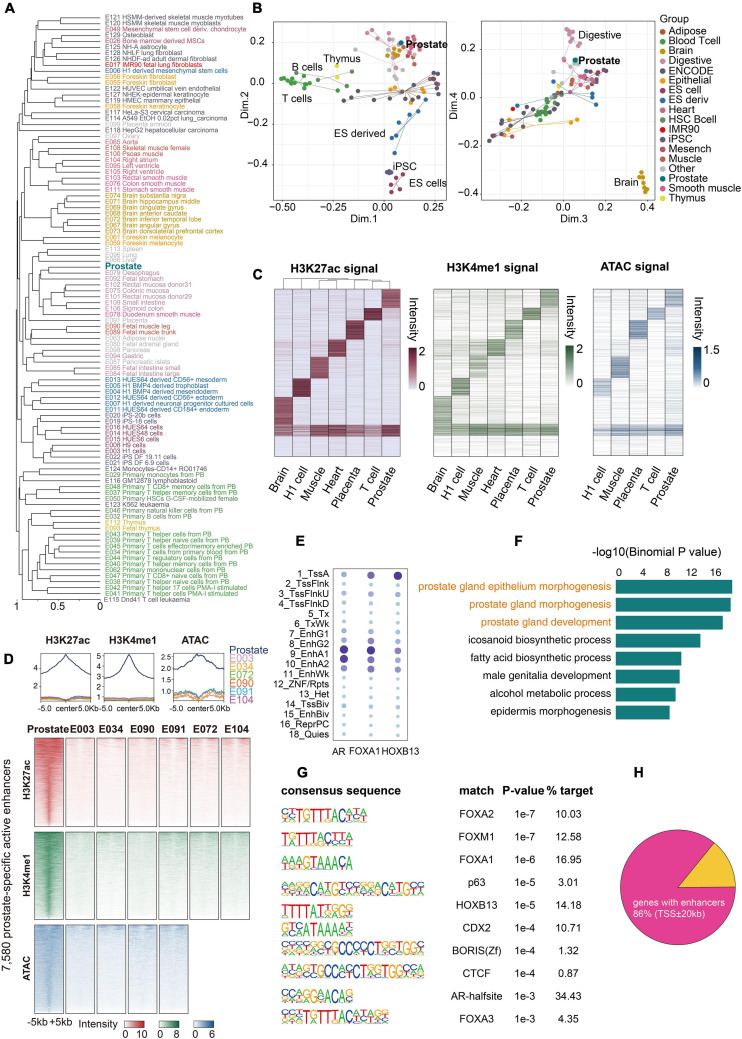
FIGURE 3.
Comparison of the prostate and other epigenomes. (A) Hierarchical clustering of prostate and other epigenomes using all active enhancers. The active enhancer states (EnhA1 and EnhA2) of 99 epigenomes were divided into non-overlapping 200-bp bins, which were then assigned 0 (no enhancers) or 1 (enhancers). The huge matrix was used to perform hierarchical clustering. (B) Multidimensional scaling (MDS) plot of all 99 epigenomes based on the same matrix used for hierarchical clustering. (C) Clustering analysis identified tissue-specific active enhancers across the prostate and six other tissues or cell types. All active enhancers were merged into a union set of regions. Values in the heatmap were normalized RPKM (reads per kilobase million) values of H3K27ac calculated from the merged regions in each sample. Normalized H3K4me1 RPKM values for seven samples and ATAC-seq RPKM values for five samples in the corresponding enhancer clusters are shown. (D) H3K27ac, H3K4me1, and ATAC-seq signals of 7,580 prostate-specific active enhancers over 10-kb regions centered on the prostate demonstrate strong signals, whereas other tissues show weak signals. (E) Enrichments for FOXA1, AR, and HOXB13 peaks of the 18-state epigenome. (F) Gene ontology (GO) terms associated with the top 1,000 prostate-specific active enhancer regions using the GREAT tool for this analysis. (G) Enriched known motifs in the prostate-specific active enhancer regions detected by HOMER2. (H) A fraction of 103 genes with active prostate enhancers.

