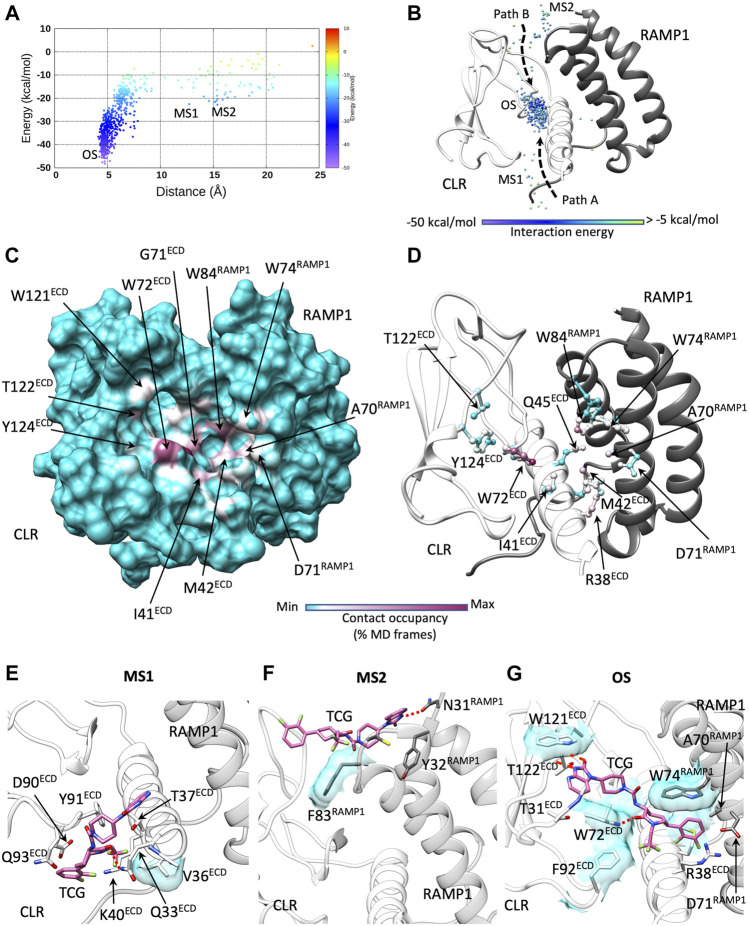
FIGURE 4.
Telcagepant dynamic docking. (A) Telcagepant binding energy landscape (the metastable macrostates, MS1 and MS2, are indicated, alongside the bound states, OS, corresponding to the pose in solved structure); (B) binding paths of the centroid of telcagepant, colored according to the interaction energy with CGRPR (the metastable macrostates, MS1 and MS2, are indicated, alongside the stable bound states OS); (C) Telcagepant-CGRPR contacts plotted on CGRPR surface and colored according to the occupancy (% MD frames) of the interactions; (D) Telcagepant-CGRPR contacts plotted on CGRPR atoms and colored according to the occupancy (% MD frames) of the interactions; (E) representative configuration from the macrostate, MS1; (F) representative configuration from the macrostate, MS2; (G) representative configuration from the bound states OS. Electrostatic interactions are depicted as red dashed lines, while hydrophobic contacts are shown as cyan transparent surfaces.

