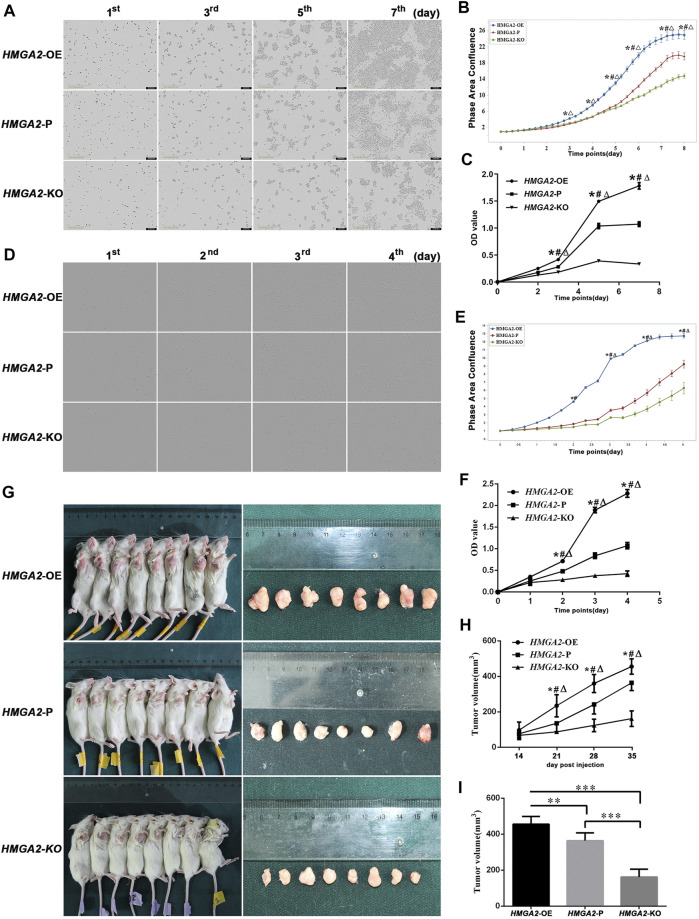
FIGURE 2.
HMGA2 promotes the proliferation of the GC cells in vitro and in vivo. (A) Growth comparison of HMGA2-edited MKN-45 cells. The images in the vertical lines are the cell proliferation at different time (first, third, fifth, and seventh days). The pictures in the horizontal lines mean different groups: upper, HMGA2-OE cells; middle, HMGA2-P cells; bottom, HMGA2-KO cells. (B) Continuous proliferation records of HMGA2-edited MKN-45 cells via IncuCyte S3. Abscissa: consecutive days; ordinate: phase area confluence. The phase area confluences of the initial seeded cells in different groups were set as 1, respectively. Blue curve: HMGA2-OE cells; red one: HMGA2-P cells; green one: HMGA2-KO cells. (C) MTT assay to detect the growth of HMGA2-edited MKN-45 cells. X-axis: different days of cell viability; Y-axis: OD value. (D) Growth comparison of HMGA2-edited MGC-803 cells. Vertical lines: different time (first, second, third, and fourth days); horizontal lines: upper, HMGA2-OE cells; middle, HMGA2-P cells; bottom, HMGA2-KO cells. (E) Continuous proliferation records of HMGA2-edited MGC-803 cells via IncuCyte S3. Abscissa: consecutive days; ordinate: phase area confluence. The phase area confluences of the initial seeded cells in different groups were set as 1, respectively. Blue curve: HMGA2-OE cells; red one: HMGA2-P cells; green one: HMGA2-KO cells. (F) Growth of HMGA2-edited MGC-803 cells measured by the MTT assay. X-axis: different days of cell viability; Y-axis: OD value. (G) Tumor-bearing mice and the isolated xenografts. The NOD/SCID mice were inoculated subcutaneously under the right axilla with HMGA2-edited MKN-45 cells at the number of 2 × 10⁶ cells suspended in 100 µL PBS. The vertical lines are the sacrificed mice with xenografts and the isolated tumor correspondingly. Upper line: mice inoculated with HMGA2-OE MKN-45 cells; middle line: HMGA2-P MKN-45 cells; bottom line: HMGA2-KO MKN-45 cells. (H) Dynamic recording of the tumor volumes. The volumes of xenografts were measured each week on living mice. X-axis: different days; Y-axis: tumor volume (mm3). (I) Isolated tumor volumes of the NOD/SCID mice inoculated with different cells. X-axis: mice groups of HMGA2-OE, HMGA2-P, and HMGA2-KO cell inoculation, respectively; Y-axis: tumor volume (mm3). Symbols for (B), (C), (E), (F), and (H): *, comparison of HMGA2-OE cells with HMGA2-P cells; △, comparison of HMGA2-OE cells with HMGA2-KO cells; #, comparison of HMGA2-P cells with HMGA2-KO cells; *,△,# p < 0.05. For (I), **p < 0.01; ***p < 0.001, Student’s t-test. Error bars represent SD.

