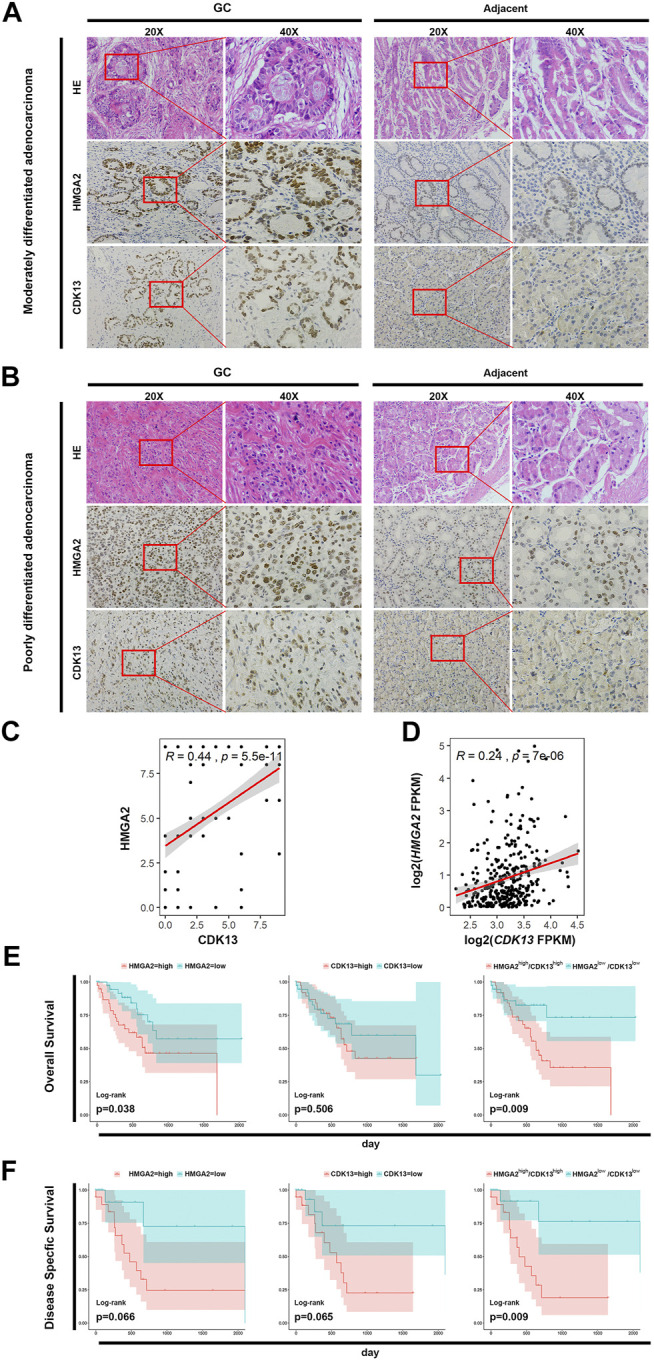
FIGURE 5.

HMGA2 and CDK13 are associated with tumorigenesis of GC. (A) Expression of HMGA2 and CDK13 in the tissues of the patients with moderately differentiated STAD. The left two columns are the HE staining and immunohistochemical results of the GC tissue. The right two columns are those from the adjacent tissue. For both GC and the adjacent group, respectively: the first column, ×20; the second one, images magnified from the red frames of the left side, ×40. Compared with the corresponding location of the adjacent tissue, the morphological disorder of cell arrangement is obvious in the GC tissue although the glands exists, which is consistent with the characteristics of this type of GC. The brown colored nuclei in the images of the second and the third horizontal line suggest HMGA2 positive and CDK13 positive, respectively. Therefore, the expressions of HMGA2 and CDK13 in GC are much higher than those in the adjacent tissue. (B) Expression of HMGA2 and CDK13 in the tissues of the patients with poorly differentiated STAD. The arrangement of images is the same as that of A. The HE staining and immunohistochemical assay were also performed on the poorly differentiated GC. The cells are more disorderly growing, losing the normal glandular morphology, and the sizes of the cells are more varied compared with those in the moderately differentiated GC, suggesting the high grade of malignancy. Positive HMGA2 or CDK13 immunohistochemical staining (in brown) localizes mainly in the nucleus of the cells. Strong positive staining in GC tissues and weak positive staining in corresponding adjacent tissues are shown. (C) Pearson’s correlation between the expression of HMGA2 and CDK13 from the immunohistochemistry results of the 200 GC tissues was calculated. X-axis: expression of CDK13; Y-axis: expression of HMGA2; R = 0.44, p = 5.5e-11. (D) Pearson’s correlation between HMGA2 and CDK13 based on the RNA-seq results of the 416 STAD patients in TCGA database was calculated. R = 0.24, P = 7e-06. (E) Kaplan–Meier survival analysis for overall survival (OS). The expression of HMGA2 and CDK13 of 76 patients with tubular STAD was stratified to OS, respectively and simultaneously. (F) Kaplan–Meier survival analysis for disease-specific survival (DSS). The expression of HMGA2 and CDK13 of 44 patients with stage IV STAD was stratified to DSS, respectively and simultaneously. For (E) and (F): left, expression of HMGA2; middle, expression of CDK13; right, expression of HMGA2 and CDK13 simultaneously. Pink color: high expression; blue: low expression.
