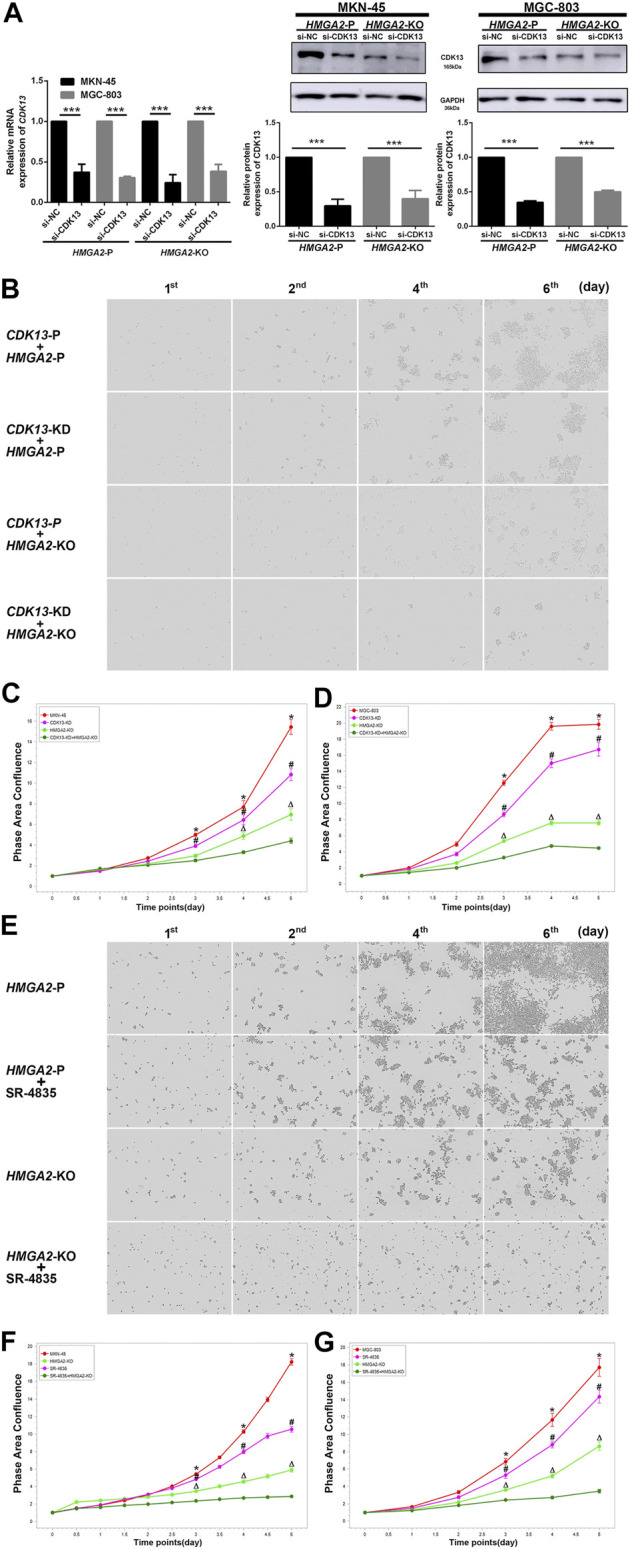
FIGURE 6.

Inhibiting CDK13 and HMGA2 simultaneously suppresses the GC cells most. (A) Efficiency of knocking down CDK13 in two GC cell lines. Left: the efficiency was verified by RT-PCR. CDK13 was knocked down based on HMGA2-P and HMGA2-KO MKN-45/MGC-803, respectively. X-axis: different cell groups. Y-axis: expression of CDK13. Middle and right: western blot results of the expression of CDK13 in HMGA2-P and HMGA2-KO MKN-45 and MGC-803, respectively. ***p < 0.001. (B) Proliferation of the MKN-45 cells in different groups. The images in the vertical lines are the cell proliferation at different time (first, second, fourth, and sixth days). The pictures in the horizontal lines mean different groups: upper, CDK13-P plus HMGA2-P cells; second, CDK13-KD plus HMGA2-P cells; third, CDK13-P plus HMGA2-KO cells; bottom, CDK13-KD plus HMGA2-KO cells. KD: knockdown; KO: knockout; P: parental. (C) Continuous records of the proliferation of the different gene-edited MKN-45 cells. (D) Continuous records of the proliferation of the different gene-edited MGC-803. For (C) and (D): abscissa, consecutive days; ordinate, phase area confluence shown via IncuCyte S3. Red curve: CDK13-P plus HMGA2-P cells; pink one: CDK13-KD plus HMGA2-P cells; light green one: CDK13-P plus HMGA2-KO cells; dark green one: CDK13-KD plus HMGA2-KO cells. The phase area confluences of the initial seeded cells in different groups were set as 1, respectively. *: comparison of CDK13-P plus HMGA2-P cells with CDK13-KD plus HMGA2-KO cells; #: comparison of CDK13-KD plus HMGA2-P cells with CDK13-KD plus HMGA2-KO cells; △: comparison of CDK13-P plus HMGA2-KO cells with CDK13-KD plus HMGA2-KO cells; *,△,# p < 0.05. (E) Proliferation of the different treated MKN-45 cells. The images in the vertical lines are the cell proliferation at different time (first, second, fourth, and sixth days). The pictures in the horizontal lines mean different groups: upper, HMGA2-P cells; the second line, HMGA2-P plus SR-4835 treated cells; the third line, HMGA2-KO cells; bottom, HMGA2-KO plus SR-4835 treated cells. (F) Continuous proliferation records of the different types of MKN-45 cells. (G) Continuous proliferation records of the different types of MGC-803. Abscissa: consecutive days; ordinate: phase area confluence shown via IncuCyte S3. Red curve: HMGA2-P cells; pink one: HMGA2-P plus SR-4835 treated cells; light green one: HMGA2-KO cells; dark green one: HMGA2-KO plus SR-4835 treated cells. The phase area confluences of the initial seeded cells in the different groups were set as 1, respectively. *: comparison of HMGA2-P cells with HMGA2-KO plus SR-4835 cells; #: comparison of HMGA2-P plus SR-4835 cells with HMGA2-KO plus SR-4835 cells; △: comparison of HMGA2-KO cells with HMGA2-KO plus SR-4835 cells; *,△,# p < 0.05.
