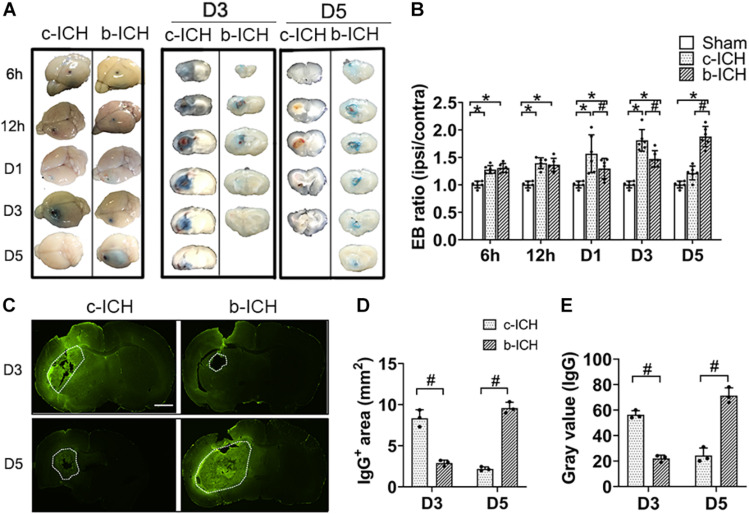
FIGURE 3.
The comparison of BBB breakdown between the c-ICH and the b-ICH groups. (A) The Evans blue staining showed that BBB leakage was present from 6 h to day 5 after ICH in two groups. (B) Quantitative analysis showed that the Evans blue (EB) concentration peaked at day 3 in the c-ICH group but on day 5 in the b-ICH group (n = 6 mice/group for each time point; *P < 0.05 vs. sham group, #P < 0.05 vs. the c-ICH group; repeated measures ANOVA followed by Bonferroni post-hoc test). (C) The IgG-positive area was determined by immunohistochemical staining on days 3 and 5, respectively (scale bar = 1 mm). (D,E) Quantification of endogenous IgG-positive area and gray values of IgG immunostaining; n = 3 mice/group; #P < 0.05 vs. c-ICH group (t-test). Values are Mean ± SD.

