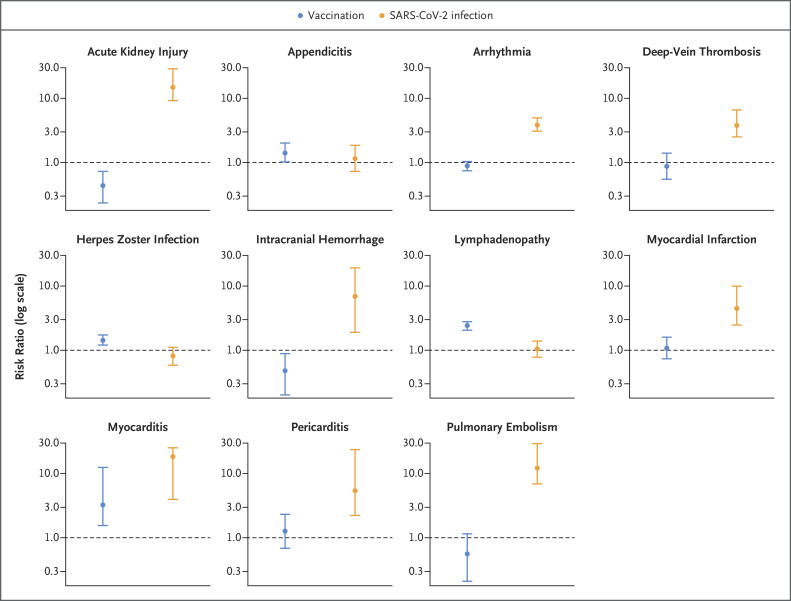
Figure 3. Risk Ratios for Adverse Events after Vaccination or SARS-CoV-2 Infection.
Estimated risk ratios for adverse events after vaccination or SARS-CoV-2 infection are shown. The risk ratio on the y axis is presented on a logarithmic scale to facilitate comparison of both increased and decreased risk. 𝙸 bars indicate 95% confidence intervals.

