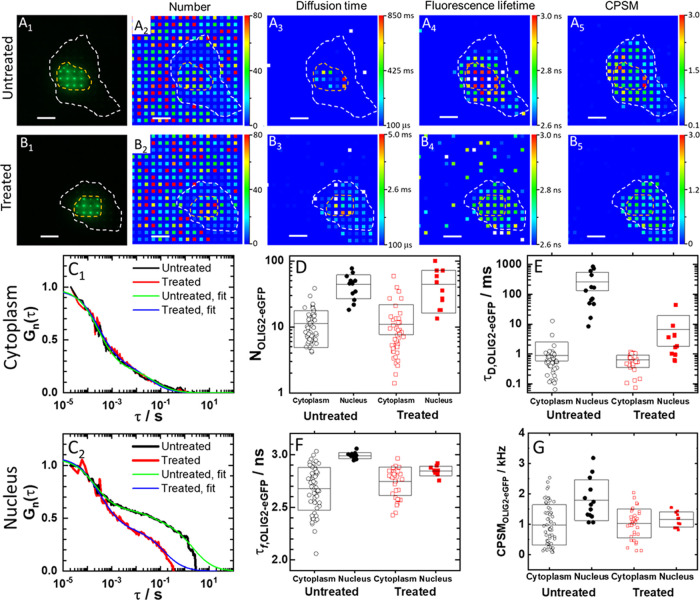
Figure 5.
Spatial map of OLIG2-eGFP concentration, diffusion, brightness, and fluorescence lifetime in a live HEK cell before and after treatment with NSC 50467. (A1, B1) Fluorescence images of an untreated (A1) and a treated (B1) HEK cell-expressing OLIG2-eGFP, acquired using a spot-wise, 16 × 16, illumination and a DSLR camera. The hand-drawn dashed lines that highlight the cell border (white) and the cell nucleus (orange) were visualized by transmission light microscopy. Corresponding fluorescence intensity fluctuation time series and ACCs are shown in Figure S18. (A2, B2) Spatial map of the average number of OLIG2-eGFP molecules in an OVE, recorded in an untreated (A2) and a treated (B2) cell. (A3, B3) Spatial map of OLIG2-eGFP diffusion times recorded in an untreated (A3) and a treated (B3) cell. (A4, B4) Spatial map of fluorescence lifetimes recorded in an untreated (A4) and a treated (B4) cell. Corresponding FLIM curves are shown in Figure S18. (A5, B5) Spatial map of OLIG2-eGFP brightness (CPSM) recorded in an untreated (A5) and a treated (B5) cell. (C1, C2) Single-pixel ACCs normalized to the same amplitude, G(20 μs) = 1 at τ = 20 μs, recorded in the same pixel in the cytoplasm (C1) and the same pixel in the cell nucleus (C2) before (black) and after (red) treatment. Two-component 3D free diffusion model fitting to the ACCs recorded in the cell nucleus and the cytoplasm in the untreated (green) and the treated (blue) cell. (D–G) Effect of treatment on the number of molecules (D), diffusion time (E), average fluorescence lifetime (F), and average molecular brightness (G).

