
FIGURE 2.
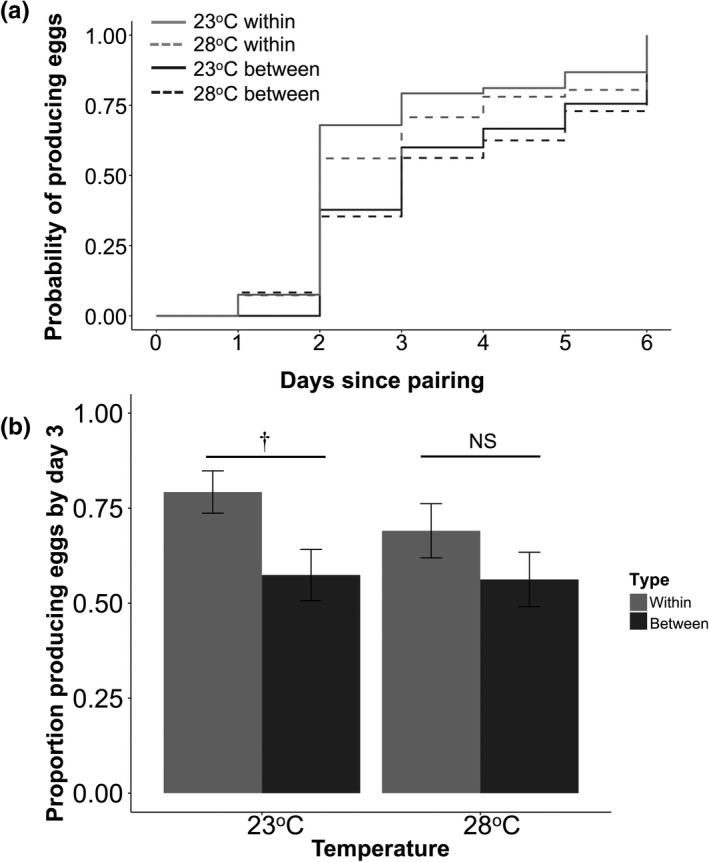
Egg production of between‐ and within‐line pairs at ambient (23°C) and elevated (28°C) temperature. (a) Latency to produce eggs with the cumulative proportion of pairs that had produced eggs plotted on each day; solid lines = ambient temperature, dashed lines = elevated temperature. (b) Proportion producing any eggs by the third day after pairing. Light gray = within‐line pairs, dark gray = between‐line pairs. Tukey‐corrected post hoc p‐values shown above: **p < 0.01; *0.01 < p < 0.05; †0.05 < p < 0.10; NS = nonsignificant