
FIGURE 3.
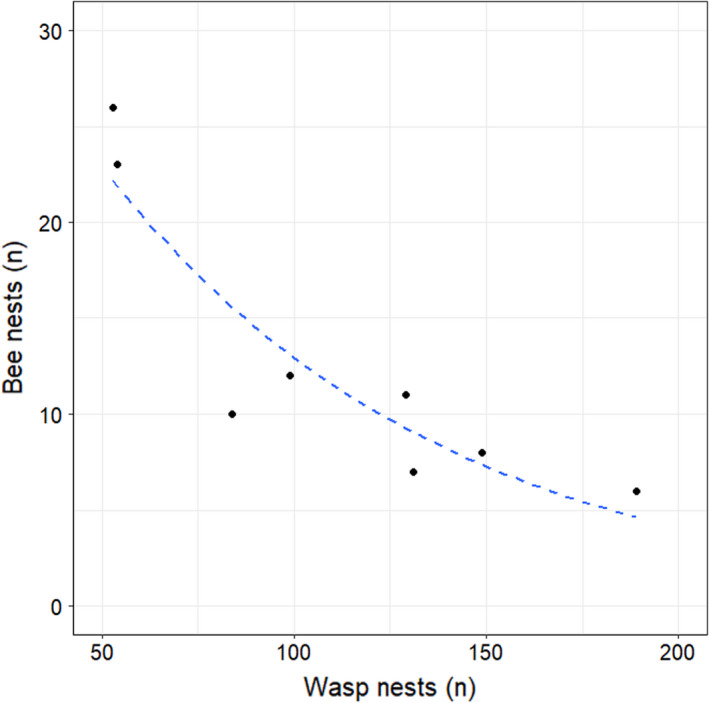
Relationship between the number of wasp and bee nests at the eight study sites. The dashed blue line represents a generalized linear model (GLM) assuming a Poisson distribution, fitted to the data points
Official websites use .gov
A
.gov website belongs to an official
government organization in the United States.
Secure .gov websites use HTTPS
A lock (
) or https:// means you've safely
connected to the .gov website. Share sensitive
information only on official, secure websites.
Relationship between the number of wasp and bee nests at the eight study sites. The dashed blue line represents a generalized linear model (GLM) assuming a Poisson distribution, fitted to the data points