FIGURE 4.

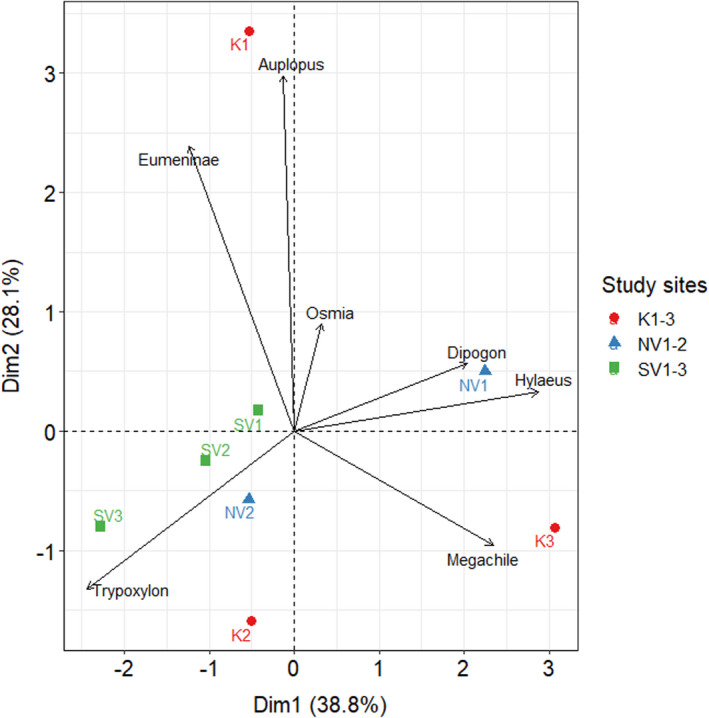
Principal component analysis (PCA) biplot of the nest numbers of the cavity‐nesting Hymenopteran taxa per site. The length of the arrows represents the strength of the association with the study sites

Principal component analysis (PCA) biplot of the nest numbers of the cavity‐nesting Hymenopteran taxa per site. The length of the arrows represents the strength of the association with the study sites