
FIGURE 5.
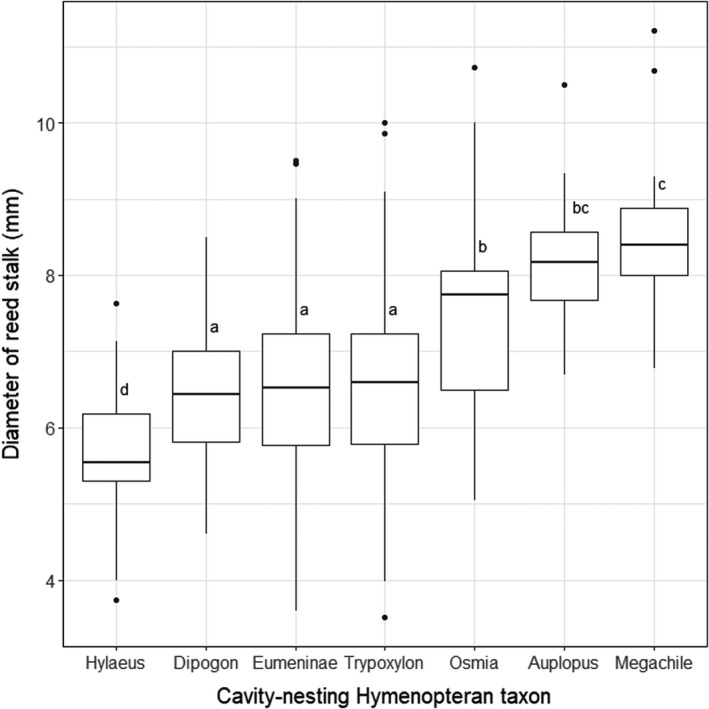
Diameter of the reed stalks with nests for the seven cavity‐nesting Hymenopteran taxa found at our study sites. The horizontal lines indicate the median value. The lower and upper whiskers represent the maximum values of the data that are within 1.5 times the interquartile range under the 25th and over the 75th percentile, respectively. Outlier values, indicated by black dots, are any values under or over this range. Same letters indicate no statistical differences between groups (Tukey's HSD test, p < 0.05)