
FIGURE 6.
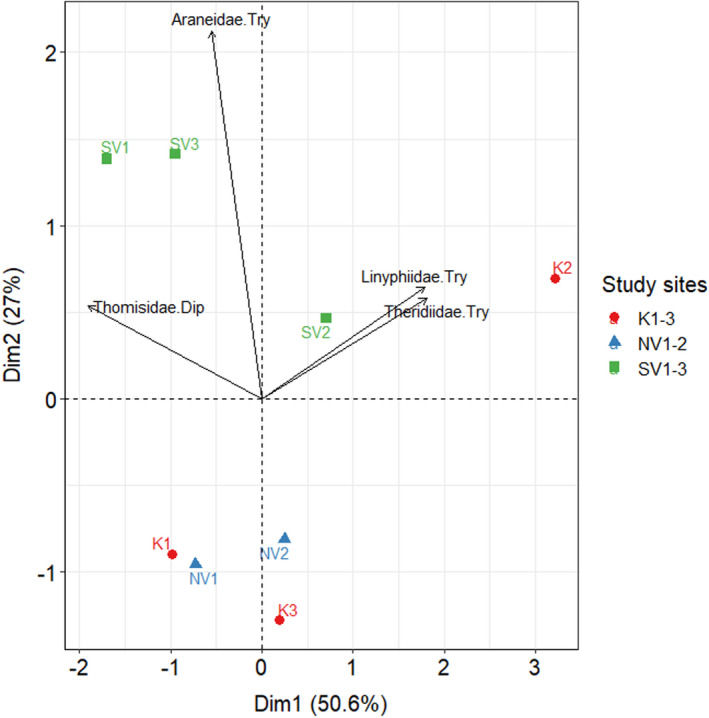
Principal component analysis (PCA) biplot of the numbers of Trypoxylon (Try) and Dipogon (Dip) spider prey per site. The length of the arrows represents the strength of the association with the study sites
Official websites use .gov
A
.gov website belongs to an official
government organization in the United States.
Secure .gov websites use HTTPS
A lock (
) or https:// means you've safely
connected to the .gov website. Share sensitive
information only on official, secure websites.
Principal component analysis (PCA) biplot of the numbers of Trypoxylon (Try) and Dipogon (Dip) spider prey per site. The length of the arrows represents the strength of the association with the study sites