Figure 5.

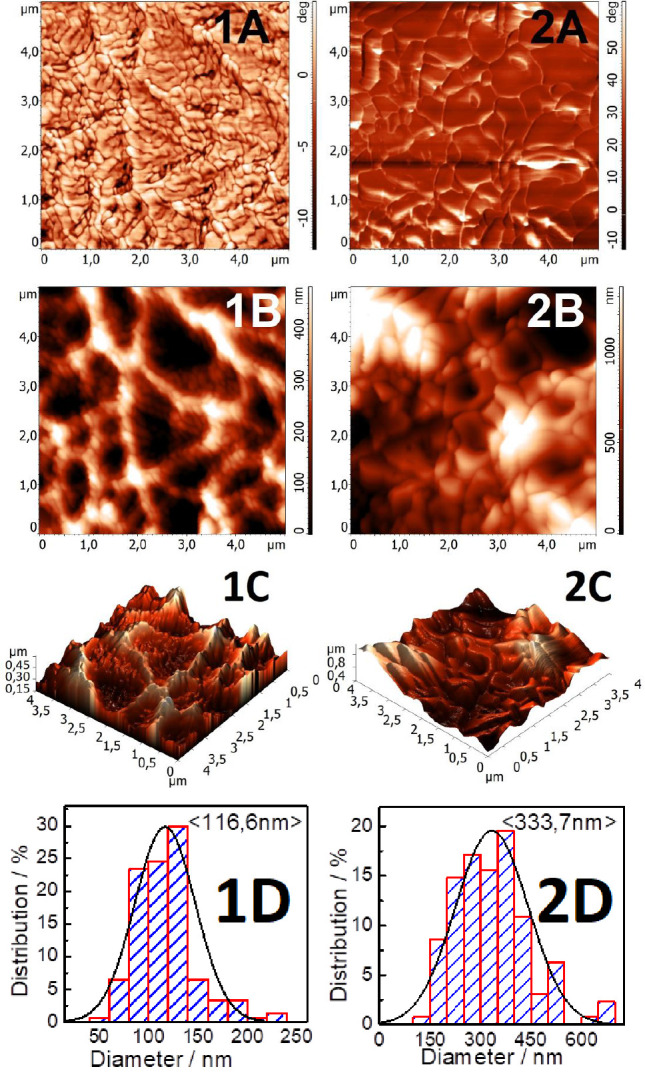
AFM data for (1) SDEAE1 and (2) SDEAE2 (A is the phase contrast, B is the relief, C is the 3D relief, and D is the particle size distribution).

AFM data for (1) SDEAE1 and (2) SDEAE2 (A is the phase contrast, B is the relief, C is the 3D relief, and D is the particle size distribution).