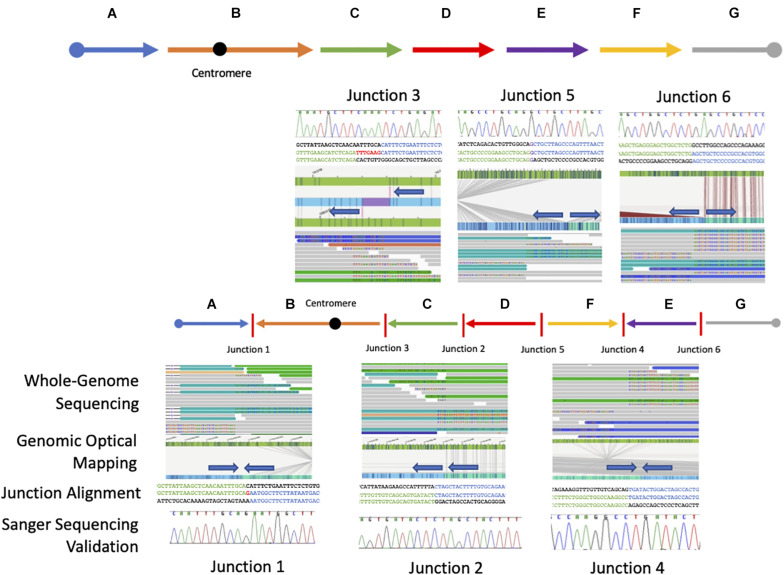
FIGURE 2.
Resolved breakpoint junctions as visualized by multiple genomic technologies. The final resolved chromosome 6 structure showing each genomic fragment orientation and the six breakpoint junctions as visualized through each technology applied including whole-genome sequencing, genomic optical mapping, breakpoint-junction alignment, and final Sanger validation. The colored arrows at the top represent the reference orientation of each genomic fragment. The arrow orientation in the middle represents the orientation of each genomic fragment in this patient with respect to reference.

