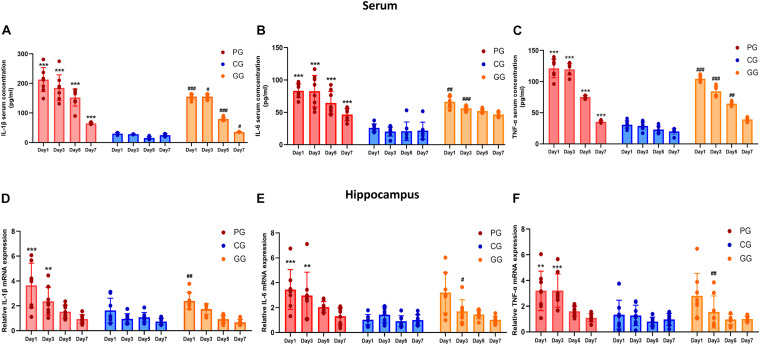
FIGURE 2.
Inflammatory cytokines are upregulated in POFS rats and relived by GRb1 in serum and hippocampus. (A–C) ELISA detects the Level of IL-1β, IL-6, and TNF-α (pg/ml) in rats’ serum (n = 8, each group), respectively. (D–F) RT-PCR detects the mRNA expression fold change of IL-1β, IL-6, and TNF-α in rats’ hippocampus (n = 8, each group), respectively. PG, POFS model group; CG, Control group; GG, Ginsenoside Rb1-treated POFS model group; ***p < 0.001, **p < 0.01 vs. the control group and ###p < 0.001, ##p < 0.01, #p < 0.05 vs. the PG at the same time point, respectively (two-way ANOVA with LSD test). Each bar represents mean ± SD.

