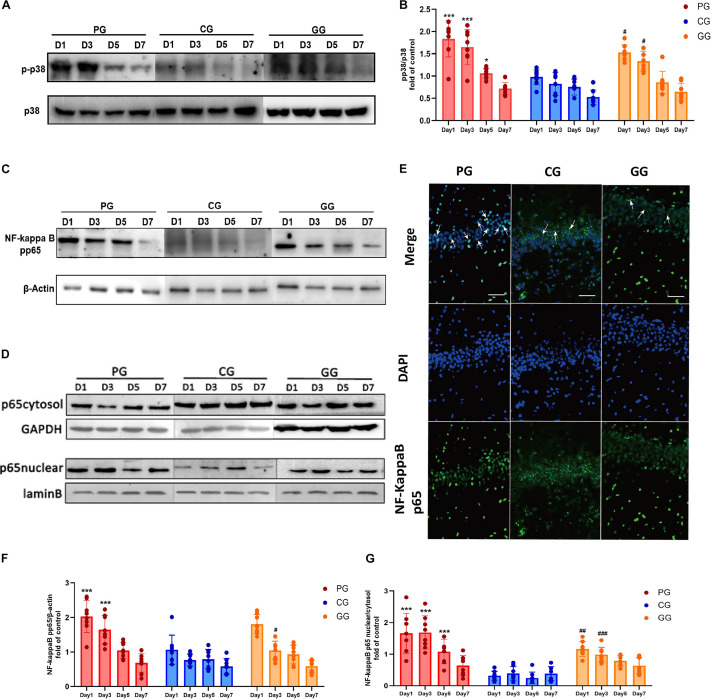
FIGURE 3.
p38MAPK-NF-κB/p65 pathway activated in POFS rats’ hippocampus and be attenuated by GRb1. (A) Representative bands of western blot of pp38MAPK and p38MAPK in different groups. (B) Levels of the relative expression of pp38MAPK/p38MAPK in hippocampus (n = 8, each group). (C) Representative bands of western blot of NF-κB/pp65 and β-actin in different groups. (D) Representative bands of western blot of NF-κB/p65 in cytoplasm and GAPDH in different groups; Representative bands of western blot of NF-κB/p65 in nucleus and lamin B in different groups. (E) Immunofluorescence detects the NF-κB/p65 transposition to nucleus in hippocampus on post-operative day 1. NF-κB/p65 (green), nucleus (DAPI, blue), scale bar, 50 μm, white arrows stand for NF-κB/p65 and DAPI merged. (F) Levels of the relative expression of NF-κB/p65/β-actin in hippocampus (n = 8, each group). (G) Levels of the relative expression of NF-κB/p65 in nucleus/NF-κB/p65 in cytoplasm in hippocampus (n = 8, each group). PG, POFS model group; CG, Control group; GG, Ginsenoside Rb1-treated POFS model group; ***p < 0.001, *p < 0.05 vs. the control group and ###p < 0.001, ##p < 0.01, #p < 0.05 vs. the PG at the same time point, respectively (two-way ANOVA with LSD test). Each bar represents mean ± SD.

