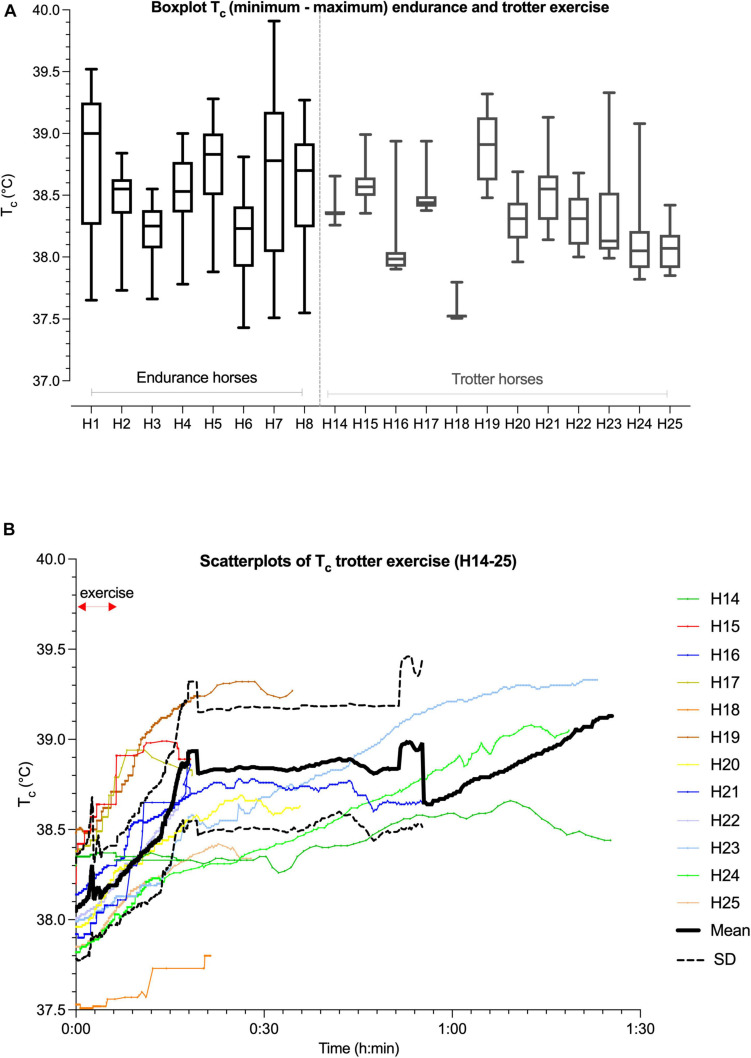
FIGURE 3.
Box and whisker plots demonstrating median (solid line), interquartile range (identified by rectangular area), and minimum to maximum (max) ranges of data (whiskers or error bars) of boxplots of Tc (°C) in horses (H; horse number) in endurance (H1–H8) and trotter (H14–H25) exercise (A). Scatterplots with Tc (°C; left y-axis) over time [duration of exercise in hours (h) and minutes (min)] (x-axis) in trotter horses (H14–25) and its mean (thick black line) ± SD (dotted black line, calculated when n > 3 horses) during high intensity trotter exercise over time (B).

