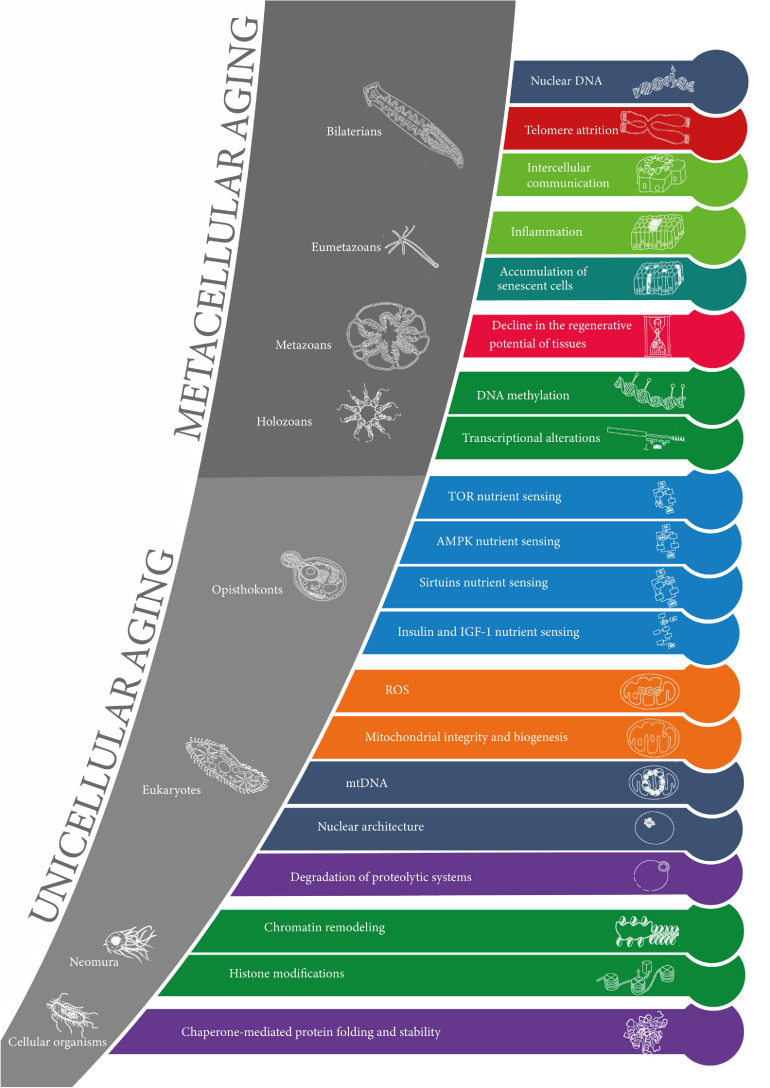
FIGURE 3.
The evolution of the hallmarks of aging. The 20 layers of aging are represented in the order of appearance in evolution from cellular organisms to bilaterians (from the earliest at the bottom to the latest at the top). The colors of the layers correspond to the original 9 “synthetic” hallmarks of aging. Clades are represented in the gray zones along with corresponding model organisms. The sets of layers of unicellular aging and metacellular aging are represented.

