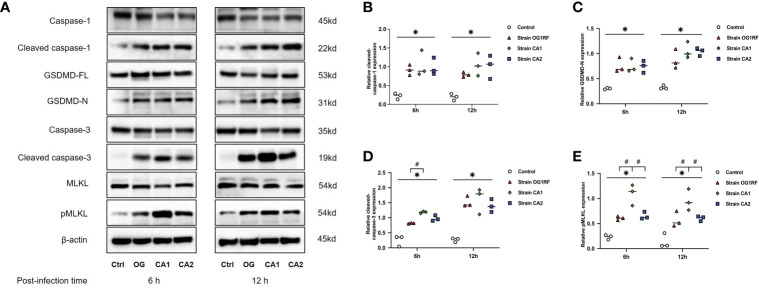
Figure 4.
Western blots showing the relative expression of PANoptosis-related proteins in RAW264.7 cells 6 and 12 h after E. faecalis infection. (A) Representative immunoblotting bands of eight proteins. Quantification of cleaved caspase-1 (B), cleaved caspase-3 (C), GSDMD-N (D), and pMLKL (E). Relative protein levels were quantified by analyzing the scanned protein bands using the ImageJ software after normalization to β-actin levels on the same blots. All experiments were repeated three times. *P < 0.05 compared to the control group. # P < 0.05 compared to the other experimental groups.

