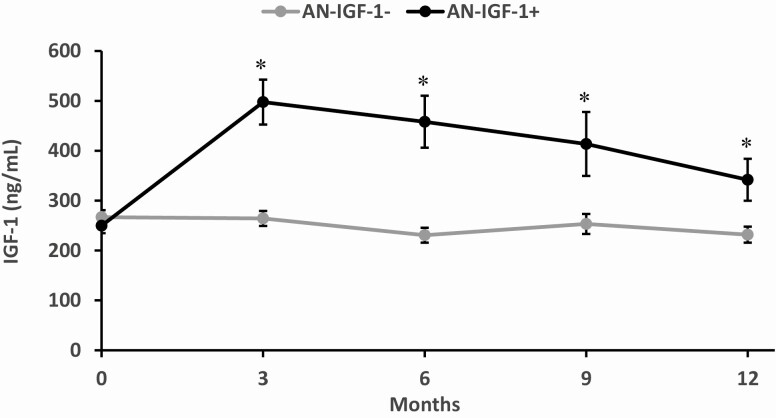
Figure 4.
IGF-1 responses by randomization group over the 12-month study course. Results are shown as mean ± standard error of the mean. AN-IGF-1+ (black dots) had significantly higher IGF-1 levels than AN-IGF-1− (gray dots) at all time points after baseline. *Denotes significant between-group difference.

