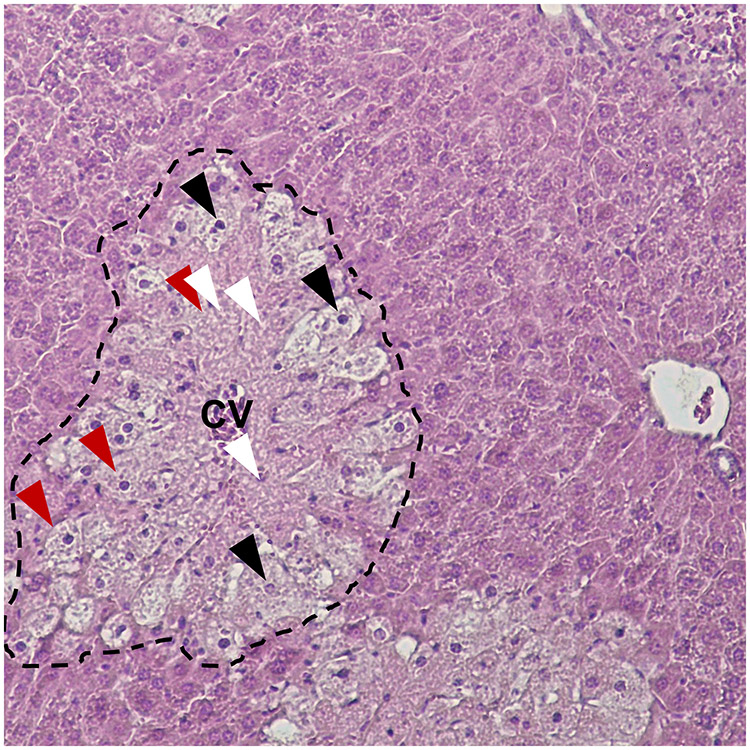
Figure 1. Histopathology of APAP-induced liver injury.
A mouse was treated with 300 mg/kg APAP. The liver was collected 24 h later. Liver tissue was fixed in 10% phosphate-buffered formalin and embedded in paraffin wax. 5 μm sections were cut, mounted on glass slides, and stained with hematoxylin and eoson. The dotted line indicates an area of hepatocellular necrosis displaying eosinophilia and loss of basophilic nuclei. Black arrowheads: Pyknosis and karyorrhexis. White arrowheads: Karyolysis. Red arrowheads: Cell swelling.

