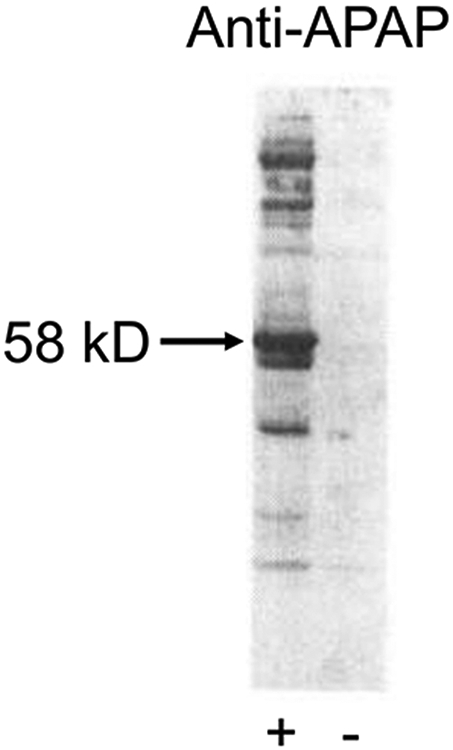
Figure 4. Anti-APAP immunoblot.

Cytosolic fractions from the livers of control (−) and 600 mg/kg APAP-treated (+) mice, isolated 2 hours after treatment. Western blotting was performed using an anti-APAP antibody. A dominant band is visible around 58 kD. Adapted from(Cohen and Khairallah 1997), with permission from the publisher.
